The President of India DR. A. P. J. Abdul Kalam 's Speech in Hyderabad .
Why is the media here so negative?
Why are we in India so embarrassed to recognize our own strengths, our achievements?
We are such a great nation. We have so many amazing success stories but we refuse to acknowledge them. Why?
We are the first in milk production.
We are number one in Remote sensing satellites.
We are the second largest producer of wheat.
We are the second largest producer of rice.
Look at Dr. Sudarshan , he has transferred the tribal village into a self-sustaining, self-driving unit. There are millions of such achievements but our media is only obsessed in the bad news and failures and disasters.
I was in Tel Aviv once and I was reading the Israeli newspaper. It was the day after a lot of attacks and bombardments and deaths had taken place. The Hamas had struck. But the front page of the newspaper had the picture of a Jewish gentleman who in five years had transformed his desert into an orchid and a granary. It was this inspiring picture that everyone woke up to. The gory details of killings, bombardments, deaths, were inside in the newspaper, buried among other news.
In India we only read about death, sickness, terrorism, crime. Why are we so NEGATIVE?
Another question: Why are we, as a nation so obsessed with foreign things? We want foreign T.Vs, we want foreign shirts. We want foreign technology.
Why this obsession with everything imported. Do we not realize that self-respect comes with self-reliance?
I was in Hyderabad giving this lecture, when a 14 year old girl asked me for my autograph.
I asked her what her goal in life is. She replied: I want to live in a developed India . For her, you and I will have to build this developed India .
You must proclaim. India is not an under-developed nation; it is a highly developed nation.
Do you have 10 minutes? Allow me to come back with a vengeance.
Got 10 minutes for your country? If yes, then read; otherwise, choice is yours.
YOU say that our government is inefficient.
YOU say that our laws are too old.
YOU say that the municipality does not pick up the garbage.
YOU say that the phones don't work, the railways are a joke. The airline is the worst in the world, mails never reach their destination.
YOU say that our country has been fed to the dogs and is the absolute pits.
YOU say, say and say. What do YOU do about it?
Take a person on his way to Singapore .
Give him a name - 'YOURS'..
Give him a face - 'YOURS'.
YOU walk out of the airport and you are at your International best.
In Singapore you don't throw cigarette butts on the roads or eat in the stores.
YOU are as proud of their Underground links as they are. You pay $5 (approx. Rs. 60) to drive through Orchard Road (equivalent of Mahim Causeway or Pedder Road) between 5 PM and 8 PM. YOU come back to the parking lot to punch your parking ticket if you have over stayed in a restaurant or a shopping mall irrespective of your status identity.
In Singapore you don't say anything, DO YOU?
YOU wouldn't dare to eat in public during Ramadan, in Dubai .
YOU would not dare to go out without your head covered in Jeddah.
YOU would not dare to buy an employee of the telephone exchange in London at 10 pounds (Rs.650) a month to,
'see to it that my STD and ISD calls are billed to someone else.
'YOU would not dare to speed beyond 55 mph (88 km/h) in Washington and then tell the traffic cop,
'Jaanta hai main kaun hoon (Do you know who I am?). I am so and so's son. Take your two bucks and get lost.'
YOU wouldn't chuck an empty coconut shell anywhere other than the garbage pail on the beaches in Australia and New Zealand .
Why don't YOU spit Paan on the streets of Tokyo ?
Why don't YOU use examination jockeys or buy fake certificates in Boston ???
We are still talking of the same YOU.
YOU who can respect and conform to a foreign system in other countries but cannot in your own. You who will throw papers and cigarettes on the road the moment you touch Indian ground.
If you can be an involved and appreciative citizen in an alien country, why cannot you be the same here in India ?
Once in an interview, the famous Ex-municipal commissioner of Bombay , Mr. Tinaikar, had a point to make. 'Rich people's dogs are walked on the streets to leave their affluent droppings all over the place,' he said. 'And then the same people turn around to criticize and blame the authorities for inefficiency and dirty pavements. What do they expect the officers to do? Go down with a broom every time their dog feels the pressure in his bowels?
In America every dog owner has to clean up after his pet has done the job. Same in Japan .
Will the Indian citizen do that here?' He's right. We go to the polls to choose a government and after that forfeit all responsibility.
We sit back wanting to be pampered and expect the government to do everything for us whilst our contribution is totally negative.
We expect the government to clean up but we are not going to stop chucking garbage all over the place nor are we going to stop to pick a up a stray piece of paper and throw it in the bin.
We expect the railways to provide clean bathrooms but we are not going to learn the proper use of bathrooms.
We want Indian Airlines and Air India to provide the best of food and toiletries but we are not going to stop pilfering at the least opportunity.
This applies even to the staff who is known not to pass on the service to the public.
When it comes to burning social issues like those related to women, dowry, girl child! and others, we make loud drawing room protestations and continue to do the reverse at home. Our excuse? 'It's the whole system which has to change, how will it matter if I alone forego my sons' rights to a dowry.' So who's going to change the system?
What does a system consist of? Very conveniently for us it consists of our neighbours, other households, other cities, other communities and the government. But definitely not me and YOU. When it comes to us actually making a positive contribution to the system we lock ourselves along with our families into a safe cocoon and look into the distance at countries far away and wait for a Mr.Clean to come along & work miracles for us with a majestic sweep of his hand or we leave the country and run away.
Like lazy cowards hounded by our fears we run to America to bask in their glory and praise their system.
When New York becomes insecure we run to England .
When England experiences unemployment, we take the next flight out to the Gulf.
When the Gulf is war struck, we demand to be rescued and brought home by the Indian government.
Everybody is out to abuse and rape the country.
Nobody thinks of feeding the system. Our conscience is mortgaged to money.
Dear Indians,
The article is highly thought inductive, calls for a great deal of introspection and pricks one's conscience too..
I am echoing J. F. Kennedy's words to his fellow Americans to relate to Indians...
'ASK WHAT WE CAN DO FOR INDIA AND DO WHAT HAS TO BE DONE TO MAKE INDIA WHAT AMERICA AND OTHER WESTERN COUNTRIES ARE TODAY'
Lets do what India needs from us.
Send this message to each Indian for a change instead of sending Jokes or junk mails.
Thank you,
Dr. Abdul Kalam
Thursday, March 20, 2008
Saturday, March 15, 2008
Preliminary Database Design Steps
Physical database design is concerned with the way data is physically stored. A physical view of a record structure shows how the logical data model is implemented.
The starting point for physical database design is a logical data model in third normal form. The physical database design is derived from the logical model. A conscious decision may be made to denormalize some files for performance reasons.
Steps in Preliminary Database Design
The primary steps to convert the logical data model to the preliminary physical data model are as follows:
- Convert entities to files (tables in relational database design).
- Convert relationships (access paths) to keys (foreign keys in relational database design).
When examining access paths, make any changes required to the database to improve performance and ease of use. These could include:
- defining additional keys to accommodate access paths,
- denormalizing files to reduce access time,
- changing file relationships to shorten chain lengths,
- tuning the database to favour more critical I/Os.
- Convert attributes to data elements (columns in relational database design).
- If necessary, denormalize data, add candidate keys, or define hierarchical relationships instead of carrying the owner record's primary key.
Note: Database design is an iterative process, making it is difficult to draw an arbitrary line between preliminary and detailed design activity. However, the objective of preliminary database design is to produce a schema against which developers can begin to write code, without focusing on the internal, physical tuning of the schema. Tuning can be done later, with little or no impact on the code.
Importance of a Stable Database Design
Changes to the database design can have a wide impact on software structure and logic design so the database design should be as complete and stable as possible before detailed application design begins.
Physical Database Design Steps & Performance Considerations
The main steps in physical database design are as follows:
- Examine performance considerations (see below).
- Determine physical file characteristics considering the elements of physical design.
- Complete the physical file design. Assign physical files to devices, determine partitions, and establish file blocking.
- Walk-through the database design with team members and, in some cases, customer representatives, to use the knowledge of other team members to uncover design flaws.
- If performance is a major issue, perform a database design review to detect possible performance problems.
- Continue to refine the database throughout design and development. Revisions, however, must be tightly controlled and circulated immediately to all affected parties to avoid endless cycles of change.
DBMS PERFORMANCE CONSIDERATIONS
The following performance considerations must be examined regardless of the DBMS selected:
- required performance level, taking into consideration:
- the number of transactions per second,
- volume of records,
- size of records,
- amount of missing data (i.e., if the application requires large amounts of non-valued data fields to be managed),
- amount of disk space, I/O, and CPU overhead required to support the DBMS,
- capability to optimize high-use transactions,
- capability to compile queries (or must queries be interpreted and optimized at every invocation?),
- query language support that manages and limits the resources consumed by on-line queries,
- report writers support that can minimize the number of passes over the data required to produce multiple reports,
- implementation of optional data compression techniques,
- impact on performance due to the DBMS implementation of checkpoint/recovery and deadlock detection techniques,
- impact on performance due to the DBMS implementation of optional security, data dictionary features, and alternative views of the data.
Elements of Physical Database File Design
Physical file design includes those aspects of database design that are usually not visible to the users and applications. The objective of physical file design is to optimize performance.
Physical data independence should not be given up unless significant improvements in machine performance can be recognized. Software dependence on physical data structures adds complexity to software design and makes maintenance more difficult. Database systems allow software design decisions to be made independent of the physical data organization and storage.
Physical file design considers the physical layout of data, addressing techniques, compaction techniques, and storage devices.
Physical Layout
Physical layout of the data is concerned with:
- the organization of files and data elements,
- partitioning of data,
- clustering of data,
- file blocking factors to maximize performance and/or reduce space requirements.
Addressing Techniques
Addressing techniques for flat files and relational database tables include:
- sequential,
- indices,
- inverted lists,
- hashed.
For network and hierarchical databases, addressing techniques include such things as:
- contiguous lists,
- indices,
- pointer methods,
- bitmaps.
Compaction Techniques
Compaction techniques include:
- the use of packed fields to reduce space requirements and improve response time,
- compression of images according to various standards, for example, Joint Photographic Experts Group (JPEG), Moving Pictures Experts Group (MPEG), Digital Video Interactive (DVI),
- compression of text and executables.
- Compressed data can reduce space requirements and help performance by:
- increasing the amount of data that can be held in main memory at one time,
- reducing the volume of data to be transmitted over communication lines.
However, there is some overhead associated with compressing/decompressing data. The tradeoffs must be evaluated.
Storage Devices
Storage devices are selected to define the storage hierarchy such as:
- main memory,
- solid state disk,
- magnetic disk,
- optical disk,
- tape.
The storage device used should match the response time requirement. Multiple devices may be used in a buffering or caching scheme to improve performance.
Physical Database Design Performance Review Steps
When high performance is required or high transaction volumes are involved, a formal and detailed review of the database design should be conducted to detect possible performance problems.
The transaction load of the system is analyzed and the number of physical I/Os are determined. The I/O total is then evaluated in terms of the selected hardware configuration and hardware capacities.
Database design review involves the following steps:
- Identify the critical transactions. Critical transactions are identified when the system architecture is defined. They are those transactions that have high volume or which require high performance.
- For each critical transaction, identify system resources consumed:
- Identify the logical I/Os.
- Determine the physical I/Os required for each logical I/O. For example, a write to a file with secondary keys will require an additional write for each secondary key.
- Use projected volumes to determine the number of physical I/Os per second.
- Determine the true number of physical I/Os per second. Consider hardware features such as:
- I/Os satisfied by disk cache. For example, if the cache hit‑rate is 50 percent then the number of expected physical reads is one half the number of physical reads,
- block splits of index or data blocks,
- extra writes for mirrored disks (e.g., Tandem),
- audit trails,
- record locking/unlocking.
- Identify System Bottlenecks.
- Compare the hardware configuration capabilities to the expected transaction load and resulting resource utilization.
- Propose solutions to eliminate system bottlenecks, such as:
- Revise the database design.
- Remove functionality that is resource intensive but of marginal benefit.
- Move some functionality to off-hours.
- Accept degraded performance during peak times.
- Expand the hardware configuration.
- Perform Technical Benchmarking if proof is required.
DATABASE DESIGN PERFORMANCE REVIEW EXAMPLE
Example: Check-out Transaction for a Public Library
The example walks through the database design review for a public library circulation system in a Tandem environment using the Enscribe relational file system.
Circulation check-out has been identified as a critical transaction.
Background: Components of the Check-out Transaction
The Check-out transaction is made up of two components: patrons and items. The logical steps involved are:
- Wand patron card, read patron record.
- Wand each item, read item record.
- Read patron activity, delete patron activity (approximately two percent of the time).
- Read reserves, rewrite reserves (approximately two percent of the time).
- Enqueue reserve (approximately two percent of the time).
- Read patron, rewrite patron (approximately five percent of the time).
- Write patron activity, rewrite item.
- Post circulation statistics (buffered every 30 minutes).
Note: Because steps three to six and step eight occur a very small percentage of the time, their reads and writes can be excluded from the totals.
Identify the Logical I/Os
The Critical Transaction Analysis form for Logical I/Os is used to identify the logical I/Os required to complete a single Check-out transaction.
The form lists the major transaction components. The logical steps performed to complete the transaction are listed, with the database files involved. Connecting the logical steps and the database files is an arrow indicating the number of logical reads, writes, and inter-process communications (IPC) required. At the bottom of the form the reads, writes, and IPCs are totalled for each major component.
Identify Physical I/Os
The Critical Transaction Analysis form for Physical I/Os is used to identify the physical I/Os required for each critical transaction (based on the logical I/Os).
To complete this form, it is necessary to have an in-depth understanding of the file's physical makeup, the number of index levels required for the different length keys (this information should be derived from analysis), and the internal behaviour of the DBMS or file system. This form uses the same diagram as the logical I/Os but the read, write, and IPC numbers are updated to reflect the physical I/O requests for each logical I/O issued.
In this example, the number of reads in steps three to six has increased enough to make them significant. After calculating their percentage weight, the number of reads per transaction to perform steps three to six is approximately 0.48 (close enough to 0.5 to be rounded to 1.0).
Transaction Summary - Physical I/Os
The Transaction - I/O Summary form for Physical I/O Requests is used to total the number of physical I/Os per second (both peak and average) for each critical transaction, based on:
- the number of physical I/Os per second,
- projected volumes.
The numbers in the three columns indicating arrival rates are supplied by the customer. The "per trans" columns under Reads and Writes is supplied from the totals listed as physical I/Os requested for each transaction. The "per sec" column is calculated by multiplying "peak per sec" by "per trans."
Transaction Summary - Actual Physical I/Os
The Transaction - I/O Summary form for Actual Physical I/Os is used to identify the "actual" or "true" physical I/O's for each critical transaction based on:
- the number of physical I/Os requested for each transaction,
- hardware and operating system feature, such as:
- cache memory,
- buffered writes,
- mirrored database files,
- audit trails,
- mirrored audit trails.
The example used is a subset of the transactions for the Circulation system. In this Tandem environment, both the database files and audit trails are mirrored. The example also makes an assumption of a 50 percent cache hit rate for reads and writes.
Using these assumptions, the calculations used are:
reads = number of physical I/Os requested / 2 (assuming 50 percent cache hits)
writes = number of physical I/Os requested * 2 (for mirrored database files)
* 2 (mirrored audit trails)
/ 2 (50 percent cache hits)
writes (net result of above) =
number of physical I/Os requested * 2
These actual physical I/O totals can now be overlaid on the hardware configuration to check for bottlenecks.
Wednesday, March 12, 2008
Data Flow Diagrams (DFDs)
Use a Data Flow Diagram (DFD) to show the relationships among the business processes within an organization to:
- external systems,
- external organizations,
- customers,
- other business processes.
Method
Data flow diagrams are used to describe how the system transforms information. They define how information is processed and stored and identify how the information flows through the processes.
When building a data flow diagram, the following items should be considered:
- where does the data that passes through the system come from and where does it go,
- what happens to the data once it enters the system (i.e., the inputs) and before it leaves the system (i.e., the outputs),
- what delays occur between the inputs and outputs (i.e., identifying the need for data stores).
STEPS TO DRAW A DATA FLOWDIAGRAM
Steps
- Start from the contextdiagram. Identify the parent process and the external entities with their net inputs and outputs.
- Place the external entities on the diagram. Draw the boundary.
- Identify the data flows needed to generate the net inputs and outputs to the external entities.
- Identify the business processes to perform the work needed to generate the input and output data flows.
- Connect the data flows from the external entities to the processes.
- Identify the datastores.
- Connect the processes and data stores with data flows.
- Apply the Process Model Paradigm to verify that the diagram addresses the processing needs of all external entities.
- Apply the External Control Paradigm to further validate that the flows to the external entities are correct.
- Continue to decompose to the nthlevel DFD. Draw all DFDs at one level before moving to the next level of decomposing detail. You should decompose horizontally first to a sufficient nth level to ensure that the processes are partitioned correctly; then you can begin to decompose vertically.
Tips andHints
Consider creating a data access model to document the processes that create, update, and delete data in the system.
As an alternative to functional decomposition, consider using a bottom-up approach when the details about the system are well known.
When analyzing the business system under study in terms of its response to events (for example, user interaction with windowed systems), consider the following:
Creating Nth Level Data Flow Diagrams
The context diagram defines the scope of the project. The first level data flow diagram (i.e., level one of decomposition) further describes and decomposes the parent process on the context diagram (i.e., level zero of decomposition).
Each process on the data flow diagram is a candidate for decomposition. A process is decomposed until it can no longer be logically broken down.
A lower level data flow diagram (i.e., nth-level) further decomposes one of the processes on a data flow diagram at one level above the lower level in the decomposition.
Steps to Decompose the Next Nth-level DFD
- The flows (i.e., inputs and outputs) of the context process (i.e., parent process) define the data flows of the nth-level data flow diagram (i.e., what the data flow diagram has been asked to do).
- For each input data flow from the parent process, identify new processes that process the input flows and identify the output data flows that these new processes create.
- For each output data flow created by the new processes in step two, identify new processes that process these flows (as input flows) and identify the output data flows that these new processes create.
- Repeat the previous step until processes have been created that link the input flows to the parent process to the output flows from the parent process.
Tuesday, March 11, 2008
Components of Data Flow Diagrams
Whatever convention is used to construct the Data Flow Diagram, all DFDs are composed of the following components:
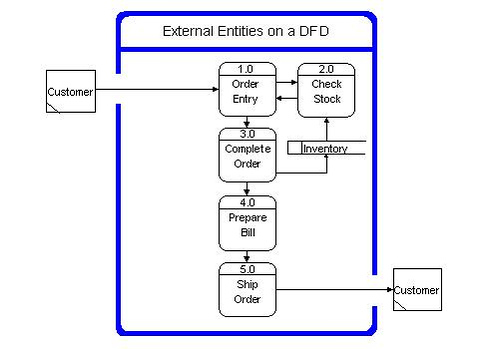
EXTERNAL ENTITIES ON A DFD
External entities are also known as terminators, sources/sinks, and actors. External entities define the sources and destinations of information entering and leaving the system. An external entity can be a person, system, or organization that has pre-defined behaviour.
External entities are mandatory on context diagrams but optional on data flow diagrams.
Description of External Entities
External entities are components that interact with a business process on the DFD but fall outside of the boundaries of the DFD.
External entities can be:
· initiators of data (i.e., spontaneous generators) flowing into the business process,
· end recipients of data (i.e., data sinks) flowing from the business process.
Examples
Examples of external entities include:
· End User,
· Purchasing Department,
· Inventory System.
Drawing External Entities on a DFD
Place external entities on the diagram with all data flows.
To reduce the visual complexity of the drawing, an external entity can be used more than once on the same DFD. Draw a diagonal line across the lower-left corner of the external entity square to indicate another occurrence of the external entity elsewhere on the same DFD.
Document External Entities
Provide a description of external entities to support the DFD.
FLOWS
Definition
Flows define the interfaces between the components within the system, and the system and its external components.
Types of Flows
Flows that transport data around the data flow diagram are called data flows.
Description of Data Flows
Data flows are the pipelines through which data are transmitted between any two components on a DFD. The composition of data is known and defined in a data dictionary.
A data flow is also called a data flow vector.
Examples of data flows are:
· purchase order,
· customer profile,
· account number,
· product.
Naming Data Flows
Data flows must be given a name that describes the content of the data being transmitted and a description of the data flow listing the data elements. For example:
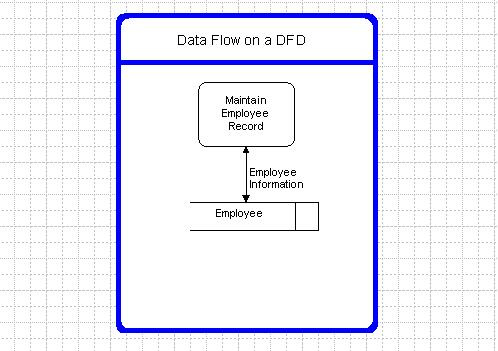
Data Flow Name: Employee Info,
Description: Information stored about an employee,
Data elements: Employee Name,
Employee Date of Birth,
Employee ID.
Bi-Directional Data Flows
Bi-directional data flows are used only when the information flowing in each direction is identical.
Data Flows with the Same Name
Multiple data flows can have the same name on a DFD. When this occurs, the data transmitted in all of the flows with the same name must be identical.
Complex Data Flows
Data flows are described as complex when there is more than one data flow going in the same direction between any two entities.
Name the complex data flow to encompass the contents of all the data flowing along the pipeline.
Trivial Data Flows
DFDs do not show trivial (relative to the specification of functional requirements) flows, such as error messages, keys for retrieving data from a data store, or data store updating instructions.
Guidelines for Drawing Data Flows on a DFD
Connect the data flows from/to external entities to/from business processes within the boundary of the DFD.
Connect internal business processes to data stores and other internal processes with appropriate data flows.
Label all data flows with care for they indicate the interface requirements for a process. Use descriptive names for labelling data flows.
Ensure that all flows to external entities on lower level diagrams balance with data flows from external entities on upper level diagrams. In other words, a new data flow cannot be created at a lower level if it was not identified on an upper level diagram.
Double-headed data flows are permitted when the data flowing in both directions are identical.
Data flows from/to external entities to/from data stores are not permitted. All data must flow through a process.
Be careful not to produce long names for complex data flows.
As a rule of thumb, a DFD component (process, data store, or external entity) should not have more than seven data flows connected to it.
Flows that access stored data are called access flows.
Flows that are used to synchronize the system control flow and do not require data are called event flows. Common uses include starting, stopping, and changing the system status. Event flows are also known as control flows.
Flows can be continuous or discrete. A discrete flow is only present for an instant of time. A continuous flow persists over time.
Types of Flows Example:
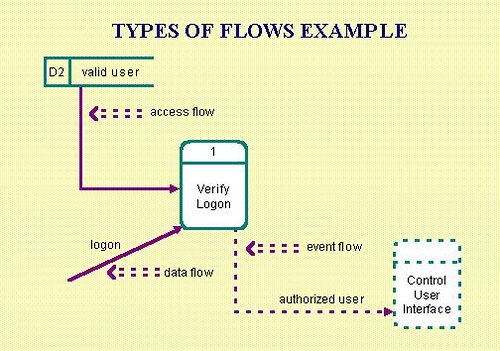
Guidelines
A data flow name should be a singular noun phrase (e.g., delivery list, customer information, credit limit).
Naming access flows is optional.
An event flow name should be a singular verb or noun phrase (e.g., start, stop, item available, processing complete).
If a data flow contains multiple attributes (i.e., data elements), an attribute list should be provided.
STORES
Definition
Stores represent information (i.e., data or control) at rest. Stores are used when different processes need to share information but are active at different times. Information can be written to a store and read from a store.
Types of Stores
Stores that contain data are called data stores.
DATA STORES ON A DFD
Identifying Data Stores
Data stores are usually derived from the entities in an entity-relationship diagram.
Creation of Data Stores
Data stores are created to store information for later use. They represent data that is temporarily at rest between processes. For example, a data store is needed to store data that is generated on a daily basis but is required for a process that runs weekly.
Local and Shared Data Stores
Local data stores are data stores whose accesses are contained completely within the boundary of a DFD.
A data store crossing the boundary of a DFD process indicates that it is shared by processes on another DFD.
Drawing Data Stores on a DFD
A data store can be drawn on the same DFD more than once to reduce the visual complexity of the drawing. An extra vertical bar is drawn in the duplicated data stores to indicate that it appears elsewhere on the same diagram.
Stores that contain status or control information are called event stores. Event stores are used to save events that have occurred but have not yet been used. Unlike a data store, an event store has behaviour associated with it which is not apparent when looking at the data flow diagram. If the system accesses an event store and the event has not occurred, the system will be suspended until the event occurs. Once an event has occurred, accessing it will remove it from the event store.
Types of Stores Example
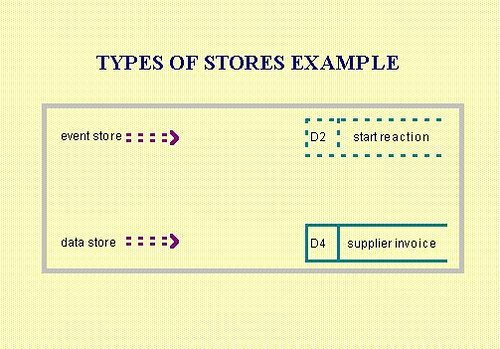
Guidelines
The data stores on the data flow diagram map to the entities on the entity-relationship diagram.
Minimize the use of event stores on the DFD. Try using flags instead.
PROCESSES
Definition
Processes are also known as data transforms. Processes transform input flows into output flows in a defined manner.
A process is a distinct activity (or set of activities) described by its inputs and outputs. A process describes a unique behaviour that has a beginning and an end. A process is performed repeatedly.
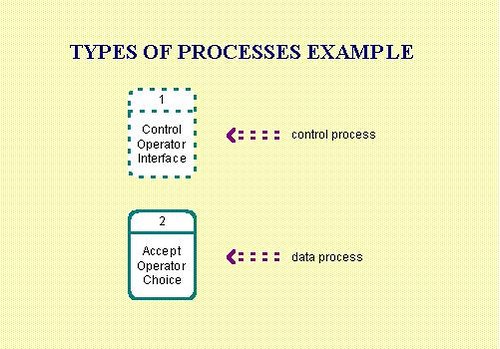
Types of Processes
A data process transforms input data into output data. Data processes act directly on data, either from flows or stores. They represent the functionality of the system.
A control process transforms input events into output events and is used on a data flow diagram to indicate the presence of a state transition diagram. Control processes cannot transform data but can control processes that do. A state transition diagram describes the behaviour of the control process.
Types of Processes Example
Guidelines
A process name and number must be unique. A process can only exist once on a data flow diagram.
A process must have at least one input and one output. In other words, a process is asked (i.e., triggered) to do something and then must deliver (i.e., respond).
A data process cannot input or output discrete event flows (i.e., a data process should not control the system, it should do the work).
A control process cannot input or output data flows (i.e., a control process should control the system, not do the work).
A process name should start with an active verb (e.g., Produce Items, Control Production).
A process exists to do something (i.e., transform input flows into output flows), therefore a process must have an incoming set of requirements to which it must conform.
An nth-level (i.e., next level of detail) data flow diagram must describe its parent process. An nth-level data flow diagram is a decomposition of its parent process and cannot introduce new functionality.
Notation
There are several conventions used to depict the DFD.
NOTATION ON A DATA FLOW DIAGRAM
Gane and Sarson
The notation described below and used in this technique was popularized by Gane and Sarson:
· Round-ended rectangles represent processes.
· Squares identify external entities.
· Arrows indicate flows.
· Open-ended rectangles identify stores.
· Diagonal line across the lower-left corner of an external entity square indicates it appears elsewhere on the same DFD.
· Extra diagonal line on a data store rectangle indicates it appears elsewhere on the same DFD.
· Double-headed arrow indicates the same data flowing in both directions.
Yourdon, DeMarco, and Others
Another notation popularized by Yourdon, DeMarco, and others is described below:
· Circles represent processes.
· Squares identify external entities.
· Arrows indicate flows.
· Rectangles open on both ends identify stores.
Extensions
To support the use of DFDs in describing how systems respond to events, the notation has been extended to include the control-oriented information typically needed to describe real-time systems. The widely adopted convention is to represent the control components using dashed lines. The extensions apply to both notations described above.
Wednesday, March 5, 2008
Use Case Models
A use case is a sequence of transactions performed by a system in response to a triggering event initiated by an actor to the system.
Use cases are normally developed early at the enterprise level and refined at the conceptual level.
They are typically used to specify or characterize the functionality and behaviour of a whole application system interacting with one or more external actors.
The use case model defines the system behaviour in terms of actors, use cases, and interactions between them. It is an external view of the system. A full use case should provide a measurable value to an actor when the actor is performing a certain task.
At the enterprise level, only the major system behaviour for the whole organization is modelled. A subset of these use cases are then expanded at the conceptual level to capture the behaviour for the specific system being analyzed.
A scenario is an instance of a use case. A scenario can be graphically depicted with a collaboration diagram, also known as an object message diagram, or a sequence diagram, also known as a message trace diagram. Scenarios are usually developed at the logical level.
Defining the Use Case Model
To create a candidate list, look at several sources of information, for example:
- The context diagram for the system shows actors (i.e., external systems). Explore how they might interact with the system. Use cases are very useful for understanding the user interface. They should be reasonably stable (according to Jacobson) prior to prototyping.
- Review any workflow from BPE projects related to the system. Start with the activities from that documentation as candidate use cases.
- Use workshops, interviews, observation of users at work, and class behaviour cards to identify requirements, objects, and responsibilities at a high level.
To identify the use cases for a problem domain consider all the possible ways in which users or other actors might interact with the target system. For example, consider the problem statement about the Automated Flight Reservation System and brainstorm some possible ways a traveler might engage the system:
- Traveler inquires about flights for a proposed travel itinerary.
- Traveler inquires about fares for a proposed travel itinerary.
- Traveler starts a travel profile.
- Traveler cancels a travel account.
- Traveler changes a reservation.
- Traveler requests a travel itinerary.
Identifying Actors
Actors may be identified early in the use case definition process, for example, from the context diagram to help identify candidate use cases. However, it is useful to also review the use cases and to confirm that the actors for the system are described and the use cases for the actors defined.
From the various use cases, it is usually straightforward to identify the actors who will interact with the target system. Systems with human-computer interfaces will include one or more types of end-user actors. Systems that interact with other software or hardware systems will include appropriate software or hardware actors.
For example, the Automated Flight Reservation System might involve traveler, travel agent, and travel agency administration actors.
Validation and Verification with Use Cases
While the primary purpose of use cases is to provide a rigorous foundation for OOA, they have also proven effective for testing object systems. Since they are an integral part of the specification they can be used for system validation. Since they can also express business requirements, they can also be used for system verification.
The Objectory method (Jacobson's method), which originated use case analysis, recommends that testing activities occur throughout the development process. Consider use cases for integration testing, where one use case implementation is integrated and tested at a time.
Evaluating Use Cases
Consider these quality criteria for assessing use cases.
Tips and Hints
Don't get too detailed too early. Understand the large pieces of functionality first, then consider the main functionality of each component. Use subordinate use cases to document exceptions and alternates. Do not clutter the main use cases.
Review the object model to ensure it remains an object implementation. Since the use cases are sequential, it is easy to produce a traditional process model.
Try to confine very detailed interaction sequences to small parts of the object model. Use a fine level of detail only for very complex processing.
Better Use Cases
Use "Use Cases" to:
· identify and communicate requirements, especially interfaces,
· refine an object model by reviewing object responsibilities and interactions,
· establish a base for testing,
· structure the system model into manageable views.
Introduction
Since Ivar Jacobson identified "use cases" in his Object-Oriented Software Engineering (OOSE) methodology, many methodologies have adapted and adopted the technique into their approach.
Jacobson distinguishes use cases from scenarios, establishing them in his methodology more formally as a model in their own right, with scenarios corresponding to "use case instances." The use case model consists of the use case diagram, which structures the use cases, and narrative descriptions of individual use cases. Sequence diagrams are used to show how objects in the object model interact in fulfilling the use case
Building the Use Case Model
The use case model is extended and refined along with the object model. The use case model itself is iterated to ensure it covers the requirements and is structured appropriately.
To define the model:
· Create a list of candidate use cases with a brief description of each.
· Prioritize the candidate list and begin describing the use cases.
· Model the relationships among the use cases. Review and structure the use cases. Consider dividing them into small use cases using the extends and uses relationships. Build a diagram that shows the relationships among the use cases.
· Extend the descriptions to secondary use cases.
· Compare the use cases to the object model.
· Assess the use cases, revise and restructure.
· Iterate.
Defining the Use Case model describes aspects of this process in more detail.
As the object model gets larger and more complex, use cases may be identified for subsets of the entire model, to refine the interactions and responsibilities of objects at a more detailed level.
Defining Collaboration Diagrams
Use a Collaboration Diagram to model the interactions between classes in the object model. Collaboration diagrams are also known as Object Message diagrams.
Collaboration diagrams are a technique for defining external object behavior. They include the same information as Sequence Diagrams (or message trace diagrams) but are better able to show asynchronous message passing. Collaboration diagrams show how objects collaborate by representing objects by icons and their message passing as labeled arrows.
Notation

In the example of the notation for a collaboration diagram, objects (actors in use cases) are represented by rectangle icons. In the example, the objects are Object1, Object2, Object…, ObjectN-1 ..., and ObjectN.
Messages passed (called interactions or events in use cases) between objects are represented by labeled arrows that start with the sending object (actor) and end with the receiving object. In the example, the sample messages passed between objects are labeled 1: message1, 2: message2, 3: message3, etc., where the numerical prefix to the message name indicates its order in the sequence. For example, Object1 first sends Object2 the message message1, Object2 in turn sends ObjectN-1 the message message2, and so on. Messages that objects send to themselves are indicated as loops (e.g., message message5).
Method
Derive the collaboration diagrams from the sequence diagrams; or create the object message trace in the same way that a sequence diagram is created, but represent it with the collaboration diagram notation. Use operation numbering to preserve the synchronous ordering of the sequence diagram from which it is derived.
To derive a collaboration diagram from a sequence diagram:
- Draw a box for each object in the sequence diagram.
- If the sequence diagram shows a message between the objects, draw a line connecting the objects on the message diagram.
- Label the line with the message name and a number identifying the sequence in which the message appears.
Use special notation (e.g., the Unified Method draws asynchronous messages with a half-arrowhead to show a one-way, synchronous control flow) to express asynchronous operations.
Example
The technique is illustrated by a simple example.

Better Sequence Diagrams
Use a Sequence Diagram to communicate interactions in the object model or as a tool to help abstract behaviours to simplify the model.
A sequence diagram illustrates the sequence of events in a use case. That is, it shows the objects interacting. Creating the diagrams allows a designer to ensure that the object model is complete. The sequence diagram:
- illustrates the actions and sequence, with a granularity (detailed, high level) depending on the nature of the action (e.g., complexity) and stage of life cycle.
- provides an effective way to understand if the object interactions can fulfill the use case. That is, if the objects involved have sufficient attributes and behaviours to complete the use case.
- serves as documentation for the messages required.
Structure
There are many notations used to represent this type of diagram. One of the most common uses a simple notation of vertical lines and horizontal arrows.
The vertical axis of the sequence diagram represents time, which increases from top to bottom. Stated otherwise, events are chronologically ordered from top to bottom.
A limitation of sequence diagrams is that they emphasize sequential, synchronous message passing. Consequently, they do not show asynchronous message passing, timing issues or other concurrent activities well.
Generic Diagram
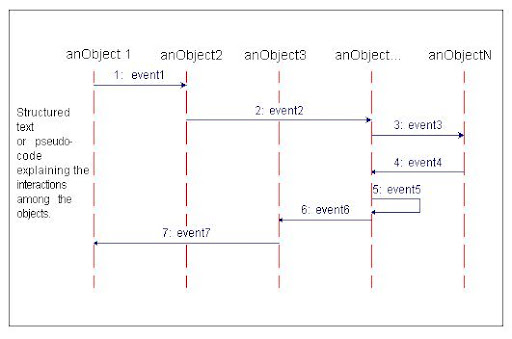
An example of a generalized structure for a sequence diagram is shown in the diagram. In the general example the objects are anObject1, anObject2, anObject3, anObject ..., and anObjectN. The example messages passed between objects are labeled 1: event1, 2: event2, 3: event3, etc., where the number prefixing the message name indicates its sequence order. For example, anObject 1 first sends anObject 2 the message event1, anObject2 in turn sends anObject... the message event2, and so on.
Method
Represent objects (that is, actors in use cases) in a sequence diagram by labeled vertical lines.
Represent messages passed (events in use cases) between objects by labeled horizontal arrows that start with the sending column (object/actor) and end with the receiving column.
Indicate messages that objects send to themselves as loops (e.g., message event5).
Identify the key classes and operations in the use case. Reduce the control flow of the use case to structured text.
For each use case identify the stimulus that initiates the event and the object to which the stimulus is sent. Identify whether that object can respond directly, or must collaborate with another object to respond. If the object collaborates, draw a labeled horizontal line to the object with which it collaborates.
Continue until all actions necessary to complete the use case are included.
An optional text description may be included with the sequence diagram for structured text or pseudo-code to explain the object interactions.
The example use case for the MTC Travel Agency requirements example is illustrated in the sequence diagram.
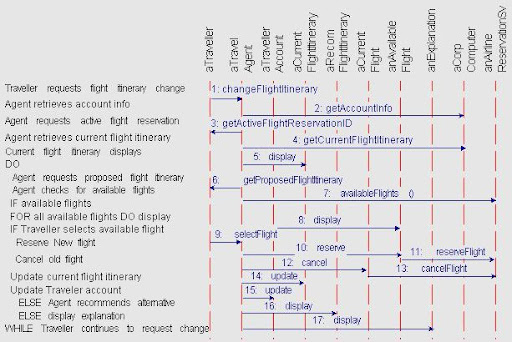
Reading the Diagram
The example use case sequence diagram can be read chronologically from top to bottom. As the structured text at the upper left indicates, the use case begins when the Traveller requests flight itinerary change. This is reflected in the graphic part of the sequence diagram by the first event, changeFlightItinerary, which aTraveller sends to aTravelAgent object. As a consequence the Travel Agent retrieves account information for aTraveller, which is shown by the second event, getTravellerAccount, which aTravelAgent sends to aCorpComputingSys.
The rest of the use case proceeds similarly, although later sequences introduce some simple logical control flow constructs, including a nested IF-THEN-ELSE statement and a DO-WHILE loop. It is a common practice to use pseudo-code in use cases in order to clarify the sequencing logic.
Tuesday, March 4, 2008
Identifying & Describing Use Cases
Prioritize the candidate list based on user input and importance to the release being built and begin describing the use cases.
Define the use case, considering the system as a black box, and focus on the interaction of the actors with the system.
Use cases can be represented both textually and graphically.
Focus on Main Use Cases
Describe the main interactions with the system. Focus on the priority use cases and on the basic course. These priority use cases are sequences of events and interactions that contain fundamental information about the system functions. Consider each primary function of the system to:
- document decisions made about the actions and sequence, with a granularity (detailed, high level) depending on the nature of the action (e.g., complexity) and stage of life cycle,
- provide an effective communication vehicle for requirements,
- serve as a set of instructions for the implementation.
Focus on the main interactions in the system. Start with an external user's interactions with the system (e.g., for a bank, start with deposit cash, withdraw cash). Create a narrative that describes what happens as the system responds to the event.
Checklist of Questions to use in Defining Use Cases
CHECKLIST OF QUESTIONS TO USE IN DEFINING USE CASES | |
| Comments |
Actors |
|
Preconditions |
|
Basic Course |
|
What are the main tasks for each actor? |
|
What system information will actors need to access or modify? |
|
Will the actor need to be informed of changes in the system state? |
|
Alternative Courses |
|
Exceptions |
|
Postconditions |
|
Assess your descriptions using the:
Guidelines for Discovering Use Cases
GUIDELINES FOR DISCOVERING USE CASES | ||||
| Yes | No | N/A | Remarks |
Is each actor’s requirements documented in a use case? For each actor, human or not, ask yourself the following questions: |
|
|
|
|
· What are the primary tasks that the actor wants the system to perform? |
|
|
|
|
· Will the actor create, store, change, remove, or read data in the system? |
|
|
|
|
· Will the actor need to inform the system about sudden external changes? |
|
|
|
|
· Does the actor need to be informed of certain events in the system? |
|
|
|
|
The answer to the above questions represent the flow of events that identify use case candidates. |
|
|
|
|
Is the flow of events described in sufficient detail? Not all use case candidates constitute separate use cases; some of them may be modelled as variants of one and the same use case. However, sometimes it’s not easy to tell what is a variant and what is, in fact, a separate and distinct use case. As the flow is detailed use cases become clearer. |
|
|
|
|
Have all sources of information been considered? For example, the company may have conducted an analysis of its enterprise, documented in some business processing engineering (BPE) deliverables. BPE documentation is a good source of use cases, since it identifies how the business process will run, and thus how the system should be used. Also, an information system embodies a set of rules that are used to run the business. These rules should be reviewed to discover potential use cases. |
|
|
|
|
Have you tried constructing a state diagram for major objects? Most information systems being built have a few major objects upon which use cases can be based. For example, a Policy Writing System has client and policy, and a Claims System has policy and claim. When trying to discover use cases, it may be helpful to generate a state diagram for each major object. The state diagram views the object from a business perspective and determines the business events that cause the object to change from state to state. |
|
|
|
|
Have you reviewed the use case model, considered other structures for the use case models, iterated and compared the use case model with the object model? There is not one single use case model possible for a system. Indeed, there may be several feasible use case models for the same system. Try developing two or three alternative models, then choose the one you prefer and develop it further. Developing several alternative models also helps you to understand the system better. |
|
|
|
|
Are all documented requirements covered in the use case model? The use cases will define the requirements for the next phase. Ensure that any previously stated requirements (e.g., in the Request for Proposal or standards) are covered. |
|
|
|
|
Use Case Quality Checklist
USE CASE QUALITY CHECKLIST | ||||
| Yes | No | N/A | Remarks |
Correctness |
|
|
|
|
Completeness |
|
|
|
|
Clarity |
|
|
|
|
Consistency |
|
|
|
|
Is the set of use cases also externally consistent with other OOAD products (e.g., class diagrams, object diagrams, state transition diagrams)? |
|
|
|
|
Verifiability |
|
|
|
|
Modifiability |
|
|
|
|
Traceability |
|
|
|
|
Use a sequence diagram to show the messages and responses of the objects with each other to complete the sequence. In analysis, describe the message with descriptive text. As the model is refined, use message names and parameter lists.
Remember that use cases do not define the object model. Return to the object model to review inheritance, examine state transitions, or document flow of control.
Structure the Use Cases
Use cases deal with complexity. Each use case considers only those objects relevant to the use case. An object participates in many use cases. All responsibilities of an object are identified by considering all use cases in which it participates.
Even complex systems can usually be described with a modest number of high-level use cases. These high-level use-cases, of course, can be used to organize as many more detailed use cases as are required.
As the object model gets larger and more complex, use cases may be identified for subsets of the entire model, to refine the interactions and responsibilities of objects at a more detailed level.
Extend to Subordinate Use Cases
A subordinate use case is a sequence of events and interactions that contains supplemental information about the system functions. The subordinate use case is used to document:
- alternate paths though the sequence,
- exceptions,
- variations on the main functionality.
Define the subordinate as a complete stand-alone use case documenting the applicable sequence. Use it to support the main use case, do not repeat the information.
- For each main use case, consider the alternatives. For example, an application received by mail may have slightly different processing, than an application received in person.
- Identify the main exception processes. For example, applicants for drivers license renewals may have their renewals automatically issued, unless they have outstanding summonses.
- Review the interactions by developing sequence diagrams for the subordinate use cases.
Monday, March 3, 2008
Guidelines for Use Case Analysis
GUIDELINES FOR USE CASE ANALYSIS | ||||
| Yes | No | N/A | Remarks |
Notation |
|
|
|
|
Organization |
|
|
|
|
Prioritization |
|
|
|
|
Efficiency |
|
|
|
|
Design Creep |
|
|
|
|
Testing Support |
|
|
|
|
Subscribe to:
Posts (Atom)