Wednesday, April 23, 2008

Windows, Linux, and Mac Hosts File Modifications

Overview

Palace servers periodically try to connect to a directory server that is no longer there. With Unix and Linux servers, this results in nothing more than a few extra log entries. However, Windows and Mac servers can experience some lag when the server is trying to make this connection. To eliminate lag from this source, and to be listed on the new Live Directory at Palacetools.com, you can create or modify a Hosts file.

Windows

  • Locate the file "Hosts" on your computer:

    Windows 95/98/Me  c:\windows\hosts
    Windows NT/2000/XP Pro  c:\winnt\system32\drivers\etc\hosts
    Windows XP Home c:\windows\system32\drivers\etc\hosts

    (you may need administrator access for Windows NT/2000/XP)

    NOTE: Hosts is the name of the hosts file and not another directory name. It does not have an extension (extensions are the .exe, .txt, .doc, etc. endings to filenames) and so appears to be another directory in the example above.

    You may have a file called "Hosts.sam". This file is a sample Hosts file (the .sam stands for sample) and can be used by removing the .sam extension so the name is just "Hosts". This file should be edited with a text editor, such as Notepad, and not a word processor, such as Microsoft Word. Use whatever you normally use to edit your cyborg.ipt or pserver.pat file.

  • Add this line to the Hosts file:
        71.155.186.91     directory.thepalace.com
  • Save your changes.
  • Reboot your computer.
  • Your server should now "register" with the Live Directory at palacetools.com.
  • If your Hosts file already contains an entry for directory.thepalace.com, then remove that entry. The above entry would be used in place of, and not in addition to any other directory.thepalace.com entry.

NOTE: Windows users should verify that they are showing extensions for all file types. This will help verify that the Hosts file is named correctly. To reset Windows to show all file extensions, double click on My Computer. Go to View Menu (Win95/98/ME) or Tools Menu (Win2000/XP), and select Folder Options. Click the View tab. In the Files and Folders section, DESELECT (uncheck) the item named "Hide file extensions for known file types". Click Apply, and then click OK.

Linux

  • Edit the hosts file on your system. The hosts file is usually found in
  • /etc/hosts
  • Add this entry to the Hosts file:
  •         71.155.186.91     directory.thepalace.com
  • Now make sure this file is used for host name lookups. This is done in two files. First is:
  • /etc/host.conf

This file should have at least the line shown below:
order hosts,bind
That has host lookups use the hosts file before doing a DNS query with bind.

  • The next file is:
  • /etc/nsswitch.conf

Recent tests indicate that this file is required in order for the pserver to use the entry in /etc/hosts. The nsswitch.conf file should have this line for the hosts configuration:
hosts:      files nisplus nis dns
There will probably already be a similar line in your version of this file. Just make sure "files" comes before whatever other methods are listed.

  • There is no need to reboot your system. Just restart your palace pservers.
  • Start up your palace.
  • It should now "register" with the Live Directory at palacetools.com.

NOTE: The above configuration instructions were tested with a linux 4.5.1 Palace server, and should also work with the linux 4.4.1 server. The 4.3.2 linux server did not respond to the above configuration when tested. Older versions were not tested.

Macintosh OS X

  • With Macintosh OS X, the procedure is similar to Linux above. The hosts file can be found in
  • /etc/hosts

Macintosh OS 9

  • Look in System Folder:Preferences, and in the System Folder itself, and see if you have a file named "Hosts". If not, create one in a text editor.
  • Add these entries to the Hosts file:
  •         paps.thepalace.com          A     127.0.0.1
            directory.thepalace.com     A     71.155.186.91
  • Spaces should work, but it is recommended that you separate the three entries on each line by tabs. The first line is the one that makes sure your downloads work, and the second line is the one that redirects your server's reporting information. Place the Hosts file in System Folder:Preferences and reboot your Mac. Start up your palace. It should now "register" with the Live Directory at palacetools.com.

If you have an older Mac that is using MacTCP instead of Open Transport, try putting the Hosts file in the System Folder.

  • Note from the Apple Tech Info Library:

Open Transport TCP/IP automatically uses a Hosts file stored the Preferences folder of the active System Folder. If no Hosts file is found in the Preferences folder, Open Transport TCP/IP searches the active System Folder for a Hosts file.
This means that if you don't already have a Hosts file, and you just drop it in your System Folder and reboot, it will work. However, System Folder:Preferences is the default and recommended location for all systems using Open Transport.

Additional Configuration Options

You can configure TCP/IP to use the contents of this new Hosts file, which will activate the Hosts file without having to reboot.
To do this:

    • Open the TCP/IP control panel.
    • Get into Advanced user mode by:
      • selecting the User Mode command under the Edit menu.
      • In the User Mode dialog select Advanced then click OK.
    • Click on the Select Hosts File button.
    • In the File Open file dialog that comes up, naviagate to and select the Hosts file you created.
    • Click on OK if it asks you if you are sure you want to replace the Hosts File with the contents of the selected file.
    • Close TCP/IP control panel and click OK to save the configuration.

The above procedure will copy the contents of the file selected into the Hosts file in the Preferences folder, or create one there if none exists.

Monday, April 7, 2008

Using the UML - A live example for Use Case Diagram

Our example application focuses on a commodity trading environment. We assume that the application supports trading and related activities at a single location.  For purposes of analysis, we are concerned with two functions:  the act of monitoring and gathering market information, and the act of completing a commodity trade.

The main users of the systems are the traders, who perform individual trades from their desks, mostly over the phone.  Traders are supported by personal workstations, connected to larger corporate servers (or administrators in our parlance). Traders rely on many sources of market information, some informal and some formal; the workstation is used to convey some of this market information, which is provided by the system of interest in two forms:  pricing information and market news, from both wire services and financial information providers.  Pricing information includes current prices of specific commodities (e.g. oil) for different time periods.  Market news includes press releases, demand and supply forecasts, wire stories, etc.  The system must collect, filter, and disseminate these news to traders.

A trader executes a trade after completing a negotiation with another trader (called a counterparty in commodities parlance).  To complete the trade, a formal contract must be  generated specifying the terms of the deal (e.g. volume, price, quantity, delivery date, mode of transportation, or combination thereof).  In addition, the trader's position in the commodity being traded must be updated appropriately.  The position is captured in a schedule often known in the industry as a slate, which gives a summary of all agreed to receipts and deliveries for a given <commodity, location, month> combination, as defined by all contracts pertaining to that combination.  Receipts and deliveries of a trade are called its legs.

Use Case Diagram:

Figure1

The use case diagram is typically of interest to users, as well as object modelers and analysts who need to perform the application domain design.  Figure 1 provides an overall picture of the usage scenarios executed by the trading system, using the classic notation introduced by Jacobson.  Individual use cases (ovals) are specified in more detail using either text, a sequence diagram, or a collaboration diagram (see below). 

The diagram captures the following:


Modeling Concept

Representation

Example(s) in diagram [1]

actor

“stick man” figure

trader, marketDataProvider, traderContact

use case

oval with label

generate contract, trade commodities

system boundary

rectangle enclosing a set of use cases

large rectangle enclosing all use cases in figure

stereotype

name of stereotype enclosed by guillemets adjacent to a model element

<<extends>>

Relationship:  participates

solid line connecting actor and use case

trader participates in the “trade commodities” use case

Relationship:  extends

<<extends>> stereotype added to inheritance notation (triangle on the base use case end of a relationship)

“distribute trade news” use case extends the “distribute news” use case.

Relationship:   uses

<<uses>> stereotype on a dashed (dependency) arrow.  Source use case includes behavior of target use case

“trade commodities” use case uses the “generate contract” use case


Sequence and Collaboration Diagrams (Specifying Use Cases)


USE CASE:  trade commodities

ACTORS:
Company trader (trader)
Counterparty trader (traderContact)


PROCESS FLOW:


When a counterparty trader wishes to trade a commodity she contacts a company trader and the request to trade the commodity is announced.

The company trader analyzes the offer to trade.  For a detailed discussion of this phase see the “analyze potential trade” use case.

The terms and conditions of the deal are then discussed and negotiated with the counterparty trader. This constitutes acceptance of the trade.

Upon acceptance, a new trade is created

The details of the trade are registered with the Trade Administrator  

The Trade Administrator makes a permanent, persistent record of the trade details and notifies the Position Administrator of the trade.

If the trade falls within an existing slate, that slate is simply updated with the details of the new trade.

If no previous trades for the same commodity, movement location and movement period have been made, the Position Administrator creates a new slate.

In either case a permanent, persistent record of the slate state is made.

The Trade Administrator provides the trade information to the Market Data Service for internal news distribution 

The Trade Administrator requests the Contract Administrator to produce a formal printed contract

PRECONDITIONS:
Credit agreement(s) in place between Company and Counterparty
Contract template(s) in place between the Company and Counterparty

POSTCONDITIONS:
A printed contract is distributed to the Counterparty
Details of the trade recorded for use by various departments (e.g., credit, scheduling)


Figure above provides a graphical description of the “trade commodities” use case supported by the trading system.  This diagram is a time ordered representation of the object interactions that occur when completing a commodity trade.  The sequence diagram is typically of interest to object modelers and analysts who need to perform the application domain design, as well as domain users.  For clarity and ease of reading, supporting text is shown next to the sequence diagram; it provides a list of actors, a process flow, preconditions, and postconditions. 

The diagram captures the following:

Modeling Concept

Representation

Example(s) in diagram

object

rectangle with labels of the form (name: class) across top of diagram, attached to a vertical dotted line

tradeAdministrator : TradeAdministrator object

message

labeled arrow between objects, arrowhead on the target object

“request commodity” message (#1)

activation (focus of control)

double vertical line on object

steps 1,3,4 on object traderContract

time sequence of messages

physical placement and sequential numbering of messages

Message “request commodity” (#1) occurs before “analyze potential trade” (#2).

Message synchronization: balking

message arrow returning on itself (indicates that sender abandons the operation if receiver is not immediately ready)

message #1, “request commodity”

Message synchronization:  synchronous

“X” near arrowhead of message

message #2, “analyze potential trade”

Message synchronization:  asynchronous

One-sided arrowhead on message

message #6, “register (trade)”

Message synchronization:  timeout

small circle attached to message

message #8, “notifyTrade”. (indicates that tradeAdministrator will abandon the message (and raise an error) if positionAdministrator cannot handle the message within a specified amount of time).

constraint (conditional execution of messages)

text within braces adjacent to messages

messages #9-10, “update {…}” & #11-12 “new {…}”
(indicates that an existing slate will be updated OR a new slate will be created and stored, depending on whether the slate already exists)

uses relationship

labeling message with name of use case

message #13, “distribute trade news (Use Case)”

timing marks

free form expression enclosed by braces

{8 + 9 + 10 < 1 sec.} (see left-hand margin)

note

rectangle with bent corner (attached to messages or objects with dotted lines), or free form text in margins

Notes on event stream implementation; states of use case and description in left hand margin


Figure 2b
A collaboration diagram is typically of interest to object modelers and analysts who need to perform the application domain design.  Figure 2b provides a graphical description of the “generate contract” use case supported by the trading system.  This diagram is presented to follow through with the <<uses>> relationship between the “trade commodities” and the “generate contract” use cases.  Also, it is presented to demonstrate the use of a collaboration diagram to describe a use case. 

The collaboration diagram captures the following (note that there is significant overlap with the modelling concepts represented in the preceding sequence diagram):

Modeling Concept

Representation

Example(s) in diagram

object

rectangle with labels of the form (name: class)

contract : Contract object

message

labeled arrow between objects; arrowhead on the target object

“generateContract” message (#1)

time sequence of messages

sequential numbering of messages

“generateContract” (#1) occurs before “constructContract” (#2).

multiobject

multiple offset rectangles (label has the same form)

contractAdministrator:  ContractAdministrator

Message synchronization:  synchronous

“X” near arrowhead of message

message #2, “constructContract”

Message synchronization:  asynchronous

One-sided arrowhead on message

message #1, “generateContract”

data/object flows and passing of parameters

arrow with circle at the tail, or method name and parameter(s)

message #1, “generateContract”  (trade object is passed to contractAdministrator)  Alternative would be generateContract(Trade)).

note

rectangle with bent corner (attached to messages or objects with dotted lines), or free form text in margins

Notes on event stream implementation

Class Diagram (Defining Application Domain)

Figure 3
A class diagram is typically of interest to the object modelers and analysts.  Figure 3 shows a static view of a portion of the domain model for the trading system.  Information on slates and counterparties is omitted here for space reasons. 

This diagram captures the following:

Modeling Concept

Representation

Example(s) in diagram

class

box with three compartments, separated by horizontal lines, showing class name (in bold), class attributes, and class operations (last two are optional) 

PositionDetail

visibility of attributes and operations

“-“ for private, “+” for public, “#” for protected

attributes and operations of PositionDetail (protected visibility does not apply to PositionDetail)

abstract class

<<abstract>> stereotype (using guillemets) in the name compartment of the class; name of class is italicized

Administrator

association

solid line between classes

TradeLeg is associated with a Trade (Trade has TradeLeg(s))

association role

text string on the relevant end of the line

Receipt, Delivery roles of Tradeleg on association between Trade and TradeLeg

multiplicity

numeric range(s) adjacent to the relevant class

Trade may have zero or more Receipt TradeLeg(s) and may have zero or more Delivery TradeLeg(s).

Relationship:   aggregation

Hollow diamond on “whole”, or aggregate, end of the association.  (Weaker association than Composition)

A TradeLeg is part of a Trade.  (Conversely a Trade has TradeLeg(s))

Relationship:  composition

Solid diamond on “whole”, or aggregate (Stronger association than Aggregation)

Position is composed of PositionDetail(s). (A PositionDetail is not meaningful or accessible outside the context of a Position, but reverse is not true)

Relationship:  generalization

large hollow triangle at the end of the association attached to the more general element

A TradeAdministrator is a subclass of  Administrator

Relationship:  dependency

broken line associations with an arrowhead attached to the independent element.

TradeLeg is dependent on Price (for computation of its value).  Price is dependent on MarketDataService (for instantiation).

note

rectangle with bent corner (attached to classes with dotted lines), or free form text in margins

note attached to the Administrator class indicating a requirement for fault-tolerance and load-balancing strategies

State Transition Diagram

Figure 4

A state transition diagram is typically of interest to analysts and developers who need to implement the detailed behavior of a class.  Figure 4a illustrates the state transitions of the Trade class from the domain class model.  Trade state transitions are dependent upon TradeLeg state transitions (not shown). 
This diagram captures the following: 

Modeling Concept

Representation

Example(s) in diagram

state

rounded rectangle 

States of Trade:  Estimated, Actualized, Canceled

substate

physical enclosure of states within another state

Delivery Estimated/Actualized and Receipt Estimated/Actualized substates within Estimated state 

concurrent substates

substates separated by broken lines within the “superstate”

the substates mentioned above (both deliveries and receipts must be actualized before entire trade is actualized)

sequential substates

physical enclosure of substates, positioned sequentially with events between them

(N/A)

pseudo-state (initial)

small solid filled circle

see top of diagram

pseudo-state (final)

circle surrounding small solid filled circle (“bull’s eye”)

see bottom of diagram

events (triggered by simple conditions)

arrow between states, with conditions specified in text

“deliveryEstimates=0”
(moving from Delivery Estimated to Delivery Actualized because there are no more estimated tradelegs)

events (triggered by receipt of messages)

event-name(parameter list)

tradeLegActualized(tradeLeg) and tradeLegEstimate(tradeLeg) events on the Estimated state (trade object is notified that a specific trade leg has been estimated or actualized; could result in changes to substates within Estimated state)

action clauses on events

event ‘/’ action-clause

estimateDelivery(…), actualizeDelivery(…), estimateReceipt(…), actualizeReceipt(…) events on the Estimated state
(on these events, the action is to increment or decrement the number of delivery or receipt estimates using the appropriate private method)

transition string

event-signature [ guard-condition ] / action-clause ^ send-clause

cancel[All Receipts and Deliveries are estimates] ^tradeLeg.cancel
(indicates that trade canot be cancelled unless all receipts and deliveries are estimates; when this holds, the action is to cancel the individual trade legs as well)

simple transition

event causing a transition from one state or substate to another

transition between the DeliveryActualized and DeliveryEstimated states labeled with the transition string “estimateDelivery(tradeLeg) [ isDeliveryLeg(tradeLeg) ] / deliveryEstimates + 1”

internal transition

Event not causing a transition from one state or substate to another (event arrow

tradeLegEstimate(tradeLeg)… (attached to a single state of Estimated)

Collaboration Diagram (Defining Application Services)

Figure 5 above presents a collaboration diagram with a set of top-level “administrator” objects, whose classes can be traced back to a domain class diagram (e.g. MarketDataService). In this particular diagram, each connection between objects represents an “application service” to be provided. A collaboration diagram such as this is typically of interest to the both the application designers and software architects, to the extent that it describes activities at the boundary of application domain design and system architecture.  Events are not numbered in the diagram, since the messages are generally executed independently.

This diagram captures the following:


Modeling Concept

Representation

Example(s) in diagram

multiobject

multiple offset rectangles

aTradeAdministrator: TradeAdministrator

link

line between objects

linkbetween aMarketDataService and Trader

(specific) message

labeled arrow along links

“hearsay” and “news” messages along association from Trader to aMarketDataService

note

rectangle with bent corner (attached to objects or links with dotted lines), or free form text in margins

Notes on requirements for fault tolerance and reliable communication channels

note stereotype

guillemets above text of note

<<requirement>> and <<constraint>> stereotypes

Class diagrams (defining implementation of a service and collaborations)

Figure 6a above presents a class diagram for a portion of the implementation of the “Market Information” service, in which the MarketDataService distributes news and price information to the employee. Notice that Employee and MarketDataService are the same classes as in the domain model, but all others are purely architectural mechanisms to implement the properties attached to this service in Figure 5. 

This diagram captures the following (some redundant features from the previous class diagram are not shown):

Modeling Concept

Representation

Example(s) in diagram

type

rectangle with type name and <<type>> stereotype

Employee, MarketDataService (variants of domain classes)

parameterized class or template

Small dashed rectangle representing parameters superimposed on upper right-hand corner of the class rectangle

GTIE_Employee (implem)

parameter for template class

text in small dashed rectangle, of form “name: type”  Type is optional

“implem” parameter (omits type)

refinement

<<refines>> stereotype on dependency arrow

“represents” dependency from GTIE_Employee<Employee_i+ > to Employee
(the first is a refinement of the second for implementation purposes.  “-i" is a CORBA naming convention)

binding, bound class

<<bind>> stereotype on dependency arrow and/or duplicated class name with parameter

dependency from GTIE_Employee<Employee_i+> to GTIE_Employee; the first class is bound to the second.

implementation-specific stereotypes

user-defined extensions to UML

<<IDL-generated>> and <<delegate>> stereotypes

note

rectangle with bent corner (attached to classes with dotted lines), or free form text in margins

Notes on requirements attached to Employee and MarketDataService


Figure 6b
Class diagrams can also be used to capture the notion of a collaboration (Figure 6b above).  A collaboration specifies a set of objects collaborating to achieve a common goal.  It can show both structural and behavioral elements; this particular diagram focuses on the structural elements in a CORBA implementation of a collaboration needed to implement the Market Information Service.

This diagram captures the following (some redundant features from the previous class diagrams are not shown):

Modeling Concept

Representation

Example(s) in diagram

collaboration

class with <<collaboration>> stereotype (user-defined)

EventStream (large rectangle)

context

nesting of entities within dominant class

All other classes, etc. lying within EventStream

enumeration

<<enumeration>> stereotype on class

Events class

parameterized or template (collaboration)

Small dashed rectangle representing parameters superimposed on upper right-hand corner of the class rectangle

EventStream class (parameters Sender, Receiver, Events)

Component Diagrams

Figure 7a
Component diagrams are typically used primarily by software developers and system administrators who are interested in how the source and executable files of the application are structured.   This is useful both during development and during deployment.  Figure 7a shows the top-level physical packaging of the commodity trading application into packages and active objects.   In a complete application, all software artifacts needed to implement the system design reside within one of the packages in the diagram [1].

This diagram captures the following: 

Modeling Concept

Representation

Example(s) in diagram

package

File folder

Desktop Tier package

active object

rectangle with darkened border with name of object underlined

OrbixD

physical composition/ nesting of packages and modules

Graphical enclosure

The TraderUI and CorporateServer packages nested within the Desktop Tier package; The OrbixD active object nested within the Orbix + ISIS Support package, which in turn is nested within the Utitlities and External Interfaces package.

dependency

dashed arrow from “client” to “supplier” package or module

Desktop Tier depends on Application Tier

layers (of software)

Dependencies coupled with physical placement of packages (higher packages at higher up on drawing are at a higher level of abstraction than lower packages)

Desktop Tier is at higher level of abstraction than Application Tier

note

rectangle with bent corner (attached to packages or modules with dotted lines), or free form text in margins

Notes on contents of Application Tier


Where more detail within a package or between packages enclosed within different package boundaries needs to be specified, a lower-level diagram can be constructed, as in Figure 7b above . In Figure 7a, the Application Tier was introduced, but its components were not shown.  In Figure 7b, the specific packages within the Application Tier package (TradeAdmininstrator-, MarketData-, Position-, and Contract- Server packages), are provided, and dependencies (both internal and external to the Application Tier) are displayed.

Deployment Diagrams 


Deployment diagrams are typically used by software architects to indicate deployment strategies and primary communication paths in the system, and by network architects as an input to network design and architecture.  Figure 8a above shows the node classes, distribution units, and connections required to deploy and run the trading system.  Notice that the structure of the nodes and connections resembles that of the objects and message paths on the collaboration diagram in Figure 5.  In addition, another node (PersistenceServerNode) and many of the distribution units found in the component diagram are included.

This diagram captures the following:


Modeling Concept

Representation

Example(s) in diagram

node

3-dimensional cube

UserNode

connection (aka communication association)

line between nodes

connection between UserNode and TradeAdministrator node

process (aka distribution unit) running on a node

Graphical enclosure of process (shown here as text representing a package or active object; alternative is enclose the package or active object itself)

MarketDataServerNode runs the MarketDataServer and OrbixD distribution units (package and module, respectively)

node stereotype

guillemets enclosed within node cube

<<client>>and <<server>> stereotypes

connection stereotype

guillemets adjacent to connection

<<Broadcast>> connection between UserNode and MarketDataServerNode  (indicates that a single MarketData Server node can broadcast the same news and prices to many UserNodes at the same time);
<<Point-to-Point> connection between UserNode and PersistenceServer (e.g. a UserNode sends messages directly to a Persistence Server node).

note

rectangle with bent corner (optionally attached to nodes with dotted lines), or free form text in margins

Notes on server replication

Figure 8a above indicates that there are user nodes (e.g. workstations) and that all server nodes are replicated, but does not specify exactly how many of each are used at any given time.  To convey this information, it is useful to create a diagram with groups of node instances rather than node classes (Figure 8b below).


Figure 8b above captures the following additional information:

Modeling Concept

Representation

Example(s) in diagram

multiplicity of nodes

number within 3-dimensional cube

6 UserNodes, 3 MarketData and TradeAdministrator Server nodes, 2 Contract and Position Server nodes

multiobject nodes

multiobject stereotype

See TradeAdministrator node


For further elaboration of characteristics of and connections between specific node instances (e.g. primary vs. backup servers), another level of detail could be shown in a separate diagram. 

[1] Example(s) shown in this column are not necessarily exhaustive, only representative.


[1] Note that the TraderUI, Database Interface, and NewsFeed Interface packages are included in the component diagram for completeness only, and in these cases, specific classes that would reside in these packages were not presented in the class diagrams above due to space limitations.

Sunday, April 6, 2008

Functional Decomposition

Functional Decomposition

Use Functional Decomposition to:

  • Hierarchically decompose a system into its functional components,
  • Hierarchically decompose a business process into sub-processes,
  • Provide a definition of all the business functions and sub-functions identified as system requirements. 


Method

  1.  Overview of Functional Decomposition
  2.  Levels of Detail for Functional Decomposition
  3.  Guidelines for Decomposing Business Functions and Processes
  4. Guidelines for Drawing a Function Chart


NOTATION ON A FUNCTION CHART

Squares indicate a business function or business process.

Solid Triangles indicate that a more detailed breakdown is provided on a subsequent Function Chart.

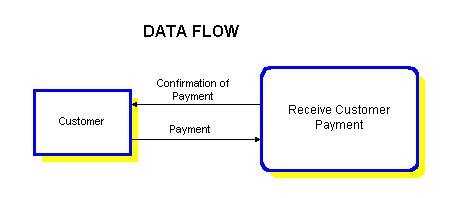
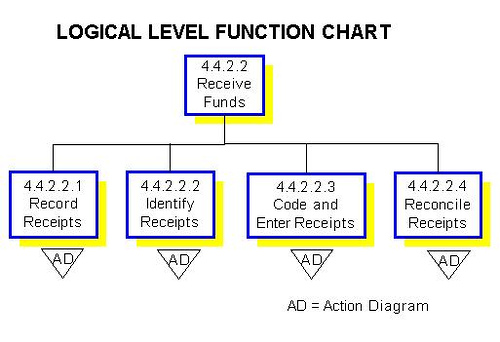
Triangles Containing Letters indicate that the function has been included on another diagram.  For example, a triangle containing "AD" indicates that the function has been further documented on an Action Diagram.  A triangle containing "DFD" indicates that the function has been further documented on a Data Flow Diagram.


Tips and Hints

Use an automated CASE tool when constructing Function Charts.

Example
 

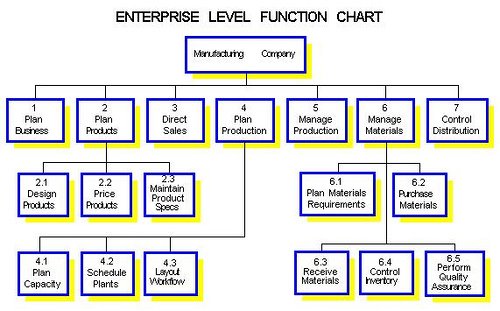
The example Function Chart decomposes the business functions for a manufacturing company.


1 Overview of Functional Decomposition 

Functional Decomposition is a fundamental analysis technique.  It breaks a complex problem into successive layers of more manageable and comprehensive pieces, resulting in a hierarchically structured Function Chart that describes the problem and/or solution in levels of increasing detail.

In Functional Decomposition, the lower level functions/processes completely describe the parent.  A function/process at a lower level cannot exist unless it is included within its parent function/process.

Functional Decomposition drives the analysis process.  The logical functions and processes become the subject, and therefore the focus, of interviews and verification activities such as walk-throughs.  Similarly, the logical processes will eventually be organized into application systems.  The Functional Decomposition must therefore be approached in a systematic manner.  It must aim to ensure that each function and process is conceptually and operationally independent.

Concepts of Coupling and Cohesion

The aim of Functional Decomposition is to identify functions which are highly cohesive and loosely coupled.  This makes them conceptually and operationally independent and promotes more stable business systems.

Coupling is a measure of the degree to which two functions are interdependent.  Loose coupling is good because changes to one function can be made with less impact on other functions, i.e., you do not have to know about other functions to make changes to the function being studied.

Cohesion is a measure of the strength of association of the processes within a function.  High cohesion is good because highly cohesive functions that perform one well-defined objective are easier to understand and maintain.

Benefits of Good Functional Decomposition

A good Functional Decomposition helps the analysis in several ways:

  • The simplicity of the structure and representation aids in understanding the breakdown of functions and processes.
  • Specifying the precise requirements and features for each function becomes easier because the functions and processes are broken down into smaller units.
  • The partitioning and independence of the functions localizes errors and minimizes system faults.
  • It allows the customer to view and discuss the organization in a form that can be dealt with, i.e., as a collection of functions, rather than as a continuous process.


Problems of a Poor Functional Decomposition

Poor Functional Decomposition can hinder the project both now and in subsequent stages by:

  • Hindering understanding of an organization's business when functions and processes overlap,
  • Creating unnecessarily numerous, complex interfaces,
  • Requiring extensive rework of other Process Modelling methods, such as Data Flow Diagrams, in later stages as detail problems emerge.

2 Levels of Detail for Functional Decomposition

Enterprise Level of Detail

At the enterprise level , the root of the Function Chart may contain the name of the organization (or a major function or sub-function within an organization).  The root is broken down into no more than three levels of detail.  A brief description is provided for each function.
 
The second level identifies major business functions, typically related to Planning, Execution, and Control.

Note that administrative functions such as Finance, Accounting, and Personnel should not be top level functions.  Top level functions should only be functions that directly contribute to the production of an organization's product or service.  Administrative functions should only be further decomposed if required, for example, if a system is being developed to support administrative functions.  Because Function Charts read so similarly to Organization Charts, i.e., both use a top-down structure, it can be politically very difficult to convince the Corporate Vice President of Finance and Personnel, for example, that his or her function is not a top level function.  One method of addressing this is to draw separate Function Charts for each of the administrative functions so that each has its own top level Function Chart.  This does not take much time, gets these functions included in the documentation, and works well as long as the charts are not further expanded.  Another method of addressing this is to include administrative functions under a function called, for instance, Organizational Support.

Conceptual Level of Detail

At the conceptual level, leaf level functions (i.e., lowest level functions) on the enterprise level chart within the context of the system are decomposed into the next level of detail.  This level identifies the major business processes necessary to accomplish each function.  Processes identified at this level typically correspond to application systems or sub-systems, for example, Sales, Finance, or Purchasing.
 
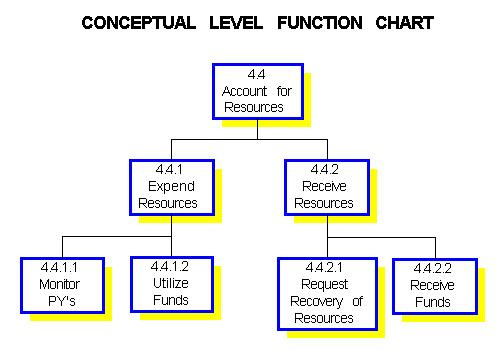
Functional Decomposition at the conceptual level of detail helps define the scope of a project.

Logical Level of Detail

At the logical level, the Function Chart decomposes processes into the lowest level of detail.  Functional Decomposition at this level identifies all the processes within the scope of the project.  The lowest level processes on the Function Chart can be documented using Action Diagrams, Structured English, or Pseudocode.
 
Once started, leaf level processes must continue to conclusion or else be totally undone.  A leaf level process takes the business from one state to another or does not change the state of the business at all.  To complete Functional Decomposition, each branch of the tree must be decomposed to the lowest level process.  However, not every branch will be decomposed to the same number of levels.

Complete understanding of the characteristics of a leaf level process requires an understanding of:

  • Volume and response time requirements, i.e., determine how often and how quickly a response from the process is required,
  • Security, i.e., determine who performs what processes,
  • Design menu structures, i.e., determine what user groups use what processes,
  • Plan for distribution, i.e., determine the geographic locations where the processes are performed.

Application Design Issue

During application design, the lowest level processes may not necessarily map directly to modules.  For example, one leaf level process may become many program modules or many leaf level processes may become one program module.


3 Guidelines for Decomposing Business Functions and Processes

Identify a Business Function

Identify the business functions.  A function is composed of a logical set of ongoing activities or processes that sustain the organization's business objectives (i.e., producing a product, providing a service).  A function can be managed but cannot be performed.

Identify Business Processes

Once the business function has been identified, define the business processes that make up the business function.

A business process is a distinct activity described by its inputs and outputs.  A process describes a unique behaviour that has a beginning and an end.  A process is performed repeatedly.

A business process may be:

  • manual,
  • automated,
  • assisted by automation.


Verbs Suitable for Naming Business Processes

The following verbs are suitable for naming business processes:

  • acquire,
  • agree,
  • assess,
  • attend,
  • build,
  • calculate,
  • check,
  • conduct,
  • create,
  • define,
  • determine,
  • develop,
  • examine,
  • identify,
  • maintain,
  • market,
  • obtain,
  • plan,
  • record,
  • remove,
  • report,
  • select,
  • specify,
  • test,
  • update.


Distinguishing Between a Business Function and a Business Process

Functions, which describe what an organization does, can be decomposed into processes that describe how the work is accomplished.

If an activity can be performed, it is a process.  Otherwise, it is a function.  For example, you cannot perform the function Marketing but you can perform the business process Contact a Customer.

Functions can break down into other functions or business processes.  Business processes can only break down into other business processes.

Criterion of Decomposition

There should be a single criterion used to differentiate between levels of the decomposition.  The criterion is the rule applied during the process of building a decomposition diagram, e.g., a Function Chart, that assures the diagram contents are consistent.

The criterion, or rule, of decomposition specifies the relationship between the function that is being decomposed and its constituent processes.


4. Guidelines for Drawing Function Charts

Description of a Function Chart

A Function Chart is a hierarchical diagram showing a progressively more detailed breakdown of the business functions and business processes of an organization.

A Function Chart does not predefine a physical design or implementation of the system.

Function Charts Versus Other Tree-Structure Diagrams

There is a fundamental difference between Function Charts and other kinds of tree-structure charts such as Organization Charts and Structure Charts.  In a Function Chart, the collection of offspring completely describes the parent.  This is not true in organization charts nor in program structure charts.  In program structure charts a parent block may invoke its child blocks.  It is essential to understand this difference to create Function Charts correctly.  A Function Chart represents the basic functions that have to be carried out regardless of what organization groups or departments exist.  A function or process may cross organizational boundaries.

Option for Displaying the Function Chart

Consider drawing your Function Chart with the root box at the left of the diagram and subsequent levels presented vertically rather than horizontally when there are numerous child blocks.

Naming Functions on a Function Chart

Name a function with a noun or a word ending in "ing."  For example, Invoicing or Human Resources Management.

Naming Business Processes on a Function Chart

Begin the name of a business process with an active verb, for example, "Pay Bills."  Use a simple imperative statement to describe the intention of the process.  For example, "Pay Invoice" or "Approve Invoice."


CONSIDERATIONS WHEN DRAWING FUNCTION CHARTS

Levels on a Function Chart

A level of a Function Chart is composed of functions or business processes.  Do not mix functions and business processes on the same level.

Each lower level of the Function Chart provides details for the level immediately above.  Lower levels are a decomposition of the upper level business function or business process, not separate from the upper level.

Complete the subordinates for any one function before further exploding any of the subordinates.  For example, if a subordinate of the function Accounting is Pay Bill, identify all subordinates of Accounting before further decomposing Pay Bill.

Administrative services or utility functions are not typically top level functions.

Rule of Thumb for Number of Subordinates

As a rule of thumb, limit the number of subordinates of a function to seven.  If there are more, group related subordinates and explode them in a lower level.  For example, the function Finance may have subordinates Funds Management, Cash, Short-Term Financing, Long-Term Financing, Financial Control, Budget, Managerial Accounting, and General Accounting.  To limit the number of subordinates under Finance, you may combine Managerial Accounting and General Accounting under Accounting and explode them at the next level.

Function Chart Numbering Scheme

Use a hierarchical numbering scheme.  For example, if the function Accounting is numbered 1 on the chart, successive breakdowns of Accounting would be numbered 1.1, 1.2, 1.1.1, and so on.

Tip for Numbering Function Chart

When numbering the charts, remember that function numbers are just a label and have no meaning.  However, the specifications document will likely be organized by function number.  Therefore, it is a good idea to assign the low numbers to the functions that should appear first in the document.  Otherwise, top level users may not understand that what they consider to be the organization's most important function is, for example, number ten and starts on page 183 of the document.

Time Dependencies

Time dependencies are not shown on Function Charts 

Saturday, April 5, 2008

Context Diagram

The Feature-Oriented Domain Analysis (FODA) Context Diagram is a data flow diagram showing data flows between a generalized application within the domain and the other entities and abstractions with which it communicates. One thing that differentiates the use of data flow diagrams in domain analysis from other typical uses is that the variability of the data flows across the domain boundary must be accounted for with either a set of diagrams or text describing the differences.
The following is an example of a context diagram for the Army Movement Control Domain

In this context diagram, the information provided to and received from the movement control domain is identified. The arrows represent the information received or generated by the movement control domain. The closed boxes represent the set of sources and sinks of information. The open ended boxes represent the databases that the movement control domain must interact with.

In the movement control domain, most of the data is produced or maintained by operations outside the scope of the domain. For example, all data about weather, terrain, and the disposition of friendly and enemy forces is obtained directly from outside the domain, as shown on the context diagram

Use a Context Diagram at the enterprise level to:

  • situate an enterprise in its operating and regulatory environment,
  • define the mission of an enterprise or its subcomponents.

Use a Context Diagram at the project level to:

  • help define the scope of a project,
  • assess potential project benefits and risk factors.

Context Diagrams at the Enterprise Level

A Context Diagram at the enterprise level of detail is referred to as a Business Context Diagram.
 
The Business Context Diagram shows the primary relationships between the organization and the external entities with which it deals.  It helps to show the main classes of information that the business must manage in dealing with its environment.

External Entities on a Business Context Diagram

An external entity is defined as an external source or destination of data.  The organization is concerned only with providing information to or receiving information from an external entity.  It is not involved with what the external entity is outside the scope of analysis.

The external entities are defined in an external entities catalogue, and the nature of the relationships (i.e., data flows) are annotated on the lines and arrow heads of the context diagram.

EXAMPLE OF AN EXTERNAL ENTITIES CATALOG

Government Legislation may impact the overall mission of the University and cause changes to strategic and tactical plans.  Government funding may also impact these plans by applying constraints to the University's implementation plans.

The User Community, of the University network, both internal and external, will influence strategic and tactical plans by making requests for hardware, software, or support.

Private Sector Funding, to a lesser extent than Government funding, may also apply constraints on the strategic and tactical plans for the University.

Industry, both inside and outside the province, will influence the strategic and tactical plans for the University by making requests to the University for services and setting new educational requirements for University programs.

The Education Community is made up of universities, public schools, vocational schools, private educational institutions, and university educators.  This group will influence the strategic and tactical plans for the University in many ways, for example, by making requests for educational services, gaining a competitive advantage through technology, or gaining advancement in educational techniques.

Information Flows on a Business Context Diagram

The information that passes between the organization and the external entities is described by the text above the arrows.  The arrows show the directional flow of the information.

Combining Business Context Diagrams

An alternate approach to creating one enterprise level diagram is to create individual Business Context Diagrams for each major component of the enterprise and then combine the diagrams to produce the overall diagram.

Steps to Constructing Context Diagrams at the Enterprise Level

Steps to develop a Business Context Diagram are:

  • Draw a process box at the center of the diagram to represent the enterprise.
  • Develop a list of candidate external entities (for example, customer, suppliers, government agencies).
  • Revise the list, as appropriate, by grouping minor external entities to keep the diagram simple.
  • Identify the data inputs and outputs between the enterprise and each external entity.
  • Draw the external entities identified by squares on either side of the center box.
  • Draw data flows with labels describing the primary relationship between the enterprise and each of the external entities.
  • Provide supporting documentation for the external entities and their inputs and outputs.
  • Review results with the customer to gain consensus.

Context Diagrams at the Project Level

Typically, a Context Diagram at the project level contains a logical business process and physical data flows. 


It illustrates the business system, not the computer system.  It shows the input and output data flows to a central process that represents the business system under analysis.  The context diagram defines the scope of the project.

Project Scope

A Context Diagram confines project scope to an agreed limit by obtaining agreement from the customer on the data flows that are included in the scope of a project.  The Context Diagram focuses on relationships with external entities and identifies the information that is exchanged between these external entities and the business system under review.  The external entities themselves are outside the scope of the project but the data flows between the entities and the business system are within the project scope.

Level of Detail

The Context Diagram at the project level is the root of the Functional Decomposition at the conceptual level of detail.  The Context Diagram is level zero of the decomposition.

Components of a Project Level Context Diagram

A Project Level Context Diagram consists of:

  • external entities,
  • central process,
  • data flows.

External Entities

External entities are also known as terminators, sources/sinks, and actors.  External entities define the sources and destinations of information entering and leaving the system.  An external entity can be a person, system, or organization that has pre-defined behaviour.

An external entity is outside the domain, or context, of the business area that is under analysis.

Justify the presence of each external entity and describe the role each plays in the scope of the project.  Describe the inputs and outputs to and from each external entity.

Central Process

The central or parent process represents the business system that is the target of analysis.  It is the highest level process that receives inputs of data from external entities and transforms that data into outputs to the external entities.  Provide a brief description (i.e., one page or less) of the central process outlining at a high level the major functionality of the business system under review.

Data Flows

Data flows are the pipelines through which data are transmitted between the external entities and the business processes.  They represent the information that flows between the two.

A data flow is also called a data flow vector.

Examples of data flows are:

  • purchase order,
  • customer profile,
  • sales report,
  • product.

Naming Data Flows

A data flow is given a name, which describes the content of the data being transmitted, and a description.  For example:

Data Flow Name:           Payment
Description:                  Payments made by customer for goods received.

Steps to Constructing a Project Level Context Diagram

  • Identify the external entities that exchange information with the business system that is the target of analysis.

    Note: If an organizational Context Diagram exists (from systems planning), extract the external entities and data flows used by the business system under review from the organizational Context Diagram.
  • Identify the data flows to and from each external entity.
  • Draw a process box at the center of the diagram to represent the highest level business process that will exchange information with the external entities.  The central process becomes the root of a process decomposition diagram, such as a Function Chart or Data Flow Diagram, which uses the flow of data as the criteria for decomposition.

Better Class Diagrams

Use a Class Diagram to model the relationships between classes in the object model.

The basic class relationships include:

  • Association: A non-specific, bi-directional relationship between two or more classes describing a group of links with common structure and semantics.  Most associations are binary.
  • Aggregation: Specifies a whole-part (or “a-part-of”) relationship between two classes. It also can be expressed as a “comprises” or “is comprised of” relationship since the containment does not have to be a physical containment.  For example, an a fuel injector is a part of an engine, it is physically contained in the engine.  A CarRentalFleet consists of many Cars.  While the cars are not physically contained in the fleet, they are part of the fleet.  Their relationship is an aggregation association.
  •         Dependency: Indicates a client-supplier relationship between two classes. 
  • Inheritance: Specifies a generalization-specialization (“is-a” or “is-a-kind-of”) relationship between two classes.  A class relationship that allows a specialized class (a subclass) to share the attributes and methods defined for one or more generalized classes (superclasses).  When the class shares attributes and behavior from only one superclass the relationship is referred to as single inheritance.  When the class shares attributes and behavior from more than one superclass it is referred to as multiple inheritance.

The definition of inheritance relationships can have significant ramifications for the object model. 

Example

The example shows some of these associations for a car rental agency:

Method

  1. Define association relationships
  2. Define inheritance relationships


1. Defining Class Associations

To build a class diagram, assess the associations:

  • Define association relationships,
  • Define aggregation relationships,
  • Define dependency relationships,
  • Assign multiplicity.

Defining Association Relationships

Look for non-specific, bi-directional relationships between two classes.  For example, in the problem domain of a car rental agency, the car rental agency manages a rental account, and a rental account is managed by a car rental agency.  They have an association relationship. Association relationships are shown by drawing a line between two classes with a semantic dependency.

Name association relationships with descriptive and concise names.  Ensure the name is consistent with the directionality of the association.  In general, an association name should suggest traversal from the “source class” to a “target class.”  For example, name the association between CarRentalAgent and Customer “serves” to indicate that CarRentalAgent (the source class) serves Customer (the target class).  In a bi-directional association like this, the choice between which class is the source and which is the target is somewhat arbitrary.  The association name isServedBy to indicate that CarRentalAgent is the target and Customer is the source.  While there are no strict rules for this, in general (as in writing prose) the active voice (serves) is preferable to the passive voice (isServedBy).

Defining Aggregation Relationships

Aggregation is a special kind of association.  Examine the classes and their associations that specify a whole-part (is-part-of) semantic dependency between two classes.  This whole-part relationship is called aggregation.  For example, in a car rental domain the CarRentalFleet consists of a collection of Car objects. Aggregation relationships are indicated by a line with a diamond on one end, where the class at the end with the diamond is the container of the class at the other end.  Or, expressed differently, the class at the end with the diamond is comprised of classes at the other end.  The containment does not have to be physical.

The CarRentalFleet class is called the aggregate class and the Car class is called the part class.

Defining Dependency Relationships

A dependency association indicates a client-supplier relationship between two classes. For example, in the car rental problem domain an AutomatedCarReservationService class supplies reservation services to class Customer.  A dependency relationship is shown as a dashed line from the client to the supplier.

Assigning Multiplicity

Assign multiplicity (also known as cardinality) to associations.  The multiplicity of an association identifies how many instances of one class can be associated with a single instance of another related class.

The three most common types of multiplicity associations are:

  • one-to-one,
  • one-to-many,
  • many-to-many.

A one-to-one multiplicity association indicates that for each instance of the source class, there is zero or one instance of the target class.  The one-to-one relationship can be expressed specifically as ‘one-to-optionally-one’ to indicate that a zero occurrence is allowed; or, as ‘one-to-one’ to indicate that exactly one occurrence of the target is associated with the source.

A one-to-many multiplicity association indicates that for each instance of the source class, there are zero or more instances of the target class.  For example, in the sample problem there are many instances of RentalRequest for each instance of CarRentalAgent.

A many-to-many multiplicity association indicates that: 1) for each instance of the source class, there are zero or more instances of the target class; and 2) conversely, for each instance of the target class, there are zero or more instances of the source class.  For example, in a car rental agency there are many instances of Customer for each instance of CarRentalAgent.  Conversely, there can be multiple instances of CarRentalAgent for each instance of Customer.


2. Defining Class Inheritance Relationships

Diagramming the inheritance relationships helps to communicate structure and inheritance of an object model. The diagram is also a tool to help abstract and simplify the model. Inheritance relationships organize classes into generalization-specialization (superclass-subclass) hierarchies; they provide a basic re-use mechanism for sharing attributes and operation

Method

Look for classes from both a top-down and bottom-up approach:

  • Look for classes with similar attributes, relationships and/or operations and generalize a superclass for them.
  • Search for classes that seem highly generalized (suggesting a superclass) and deduce specialized classes (subclasses) from them.

Draw the hierarchy diagram using the same conventions as for an Entity Relationship diagram. Treat each class as an entity. Treat subclasses in the same way as subtypes. A simple example illustrates the diagrammed inheritance relationship.

A big difference between entities and objects in defining relationships is that object relationships emphasize behavior, not just attributes. Creating a superclass just to handle common attributes is not good practice.

Consider the following checklist to assess inheritance.

Inheritance Relationship Checklist

Sample Checklist Template

INHERITANCE RELATIONSHIP CHECKLIST


Yes

No

N/A

Remarks

Use the following to identify when an enumerated attribute should be used instead of inheritance:

Is the object’s identity more important than just an attribute value?


Does the object have behavior essential to the business?


Is there more than one simple attribute for this proposed subclass?


Do instances have different behavior and attributes when a value is given to an enumerated attribute?


If the answer is no to any of the questions, model as an enumerated attribute of the class, not as a subclass. The element that would have been the discriminator among subclasses becomes an enumerated attribute of the class. Typically "IF-THEN-ELSE" or CASE logic is used to handle the differences in behavior based on the enumerated attribute.

Use and expand as needed...

Consider Generalizations

Look for a super class that you can generalize from the classes in the evolving object model.

Consider classes that have similar names (e.g., ending in Service) and similar attributes. These classes probably have different behavior (e.g., different initializations and different operations), but their common attribute structure suggests that they are good candidates for generalization into a superclass GeneralizedService (a more specific name would be used in a real model). Derive the attributes for the superclass GeneralizedService by intersecting the attributes of the subclasses.

Deduce Specializations

Search for classes that seem highly generalized (suggesting a superclass) and deduce specialized classes (subclasses) from them.

Consider, for example, a requirement to accommodate both individual and corporate travel accounts. This difference could be modeled trivially using an attribute; however, if there are substantive differences between individual and corporate travel accounts, then a better mechanism is the inheritance structure. Consequently, derive two subclasses from TravelAccount: CorporateTravelAccount and IndividualTravelAccount.

Tips and Hints

Don’t inherit from a superclass just so you can access its private attributes and operations. That is, ensure that the subclass is really a specialization or refinement of the superclass, an that inheritance is not just a mechanism to allow a largely unrelated class to use a method. Make sure that the inheritance relationship promotes re-use and is consistent with the rest of the object model.

Make sure that the attributes and operations of superclasses are being well used by their subclasses. Look for superclasses that are under- or over-used, and balance the inheritance hierarchy accordingly.

Be careful about using multiple inheritance. The inappropriate use of multiple inheritance can lead to class inheritance hierarchies that are difficult to understand. Also consider that multiple inheritance is not supported by all OOP languages (e.g., Smalltalk).
An abstract class should only inherit from another abstract class, not from a class having instantiations.


Friday, April 4, 2008

The Simplicity PHP Framework!

The Simplicity PHP Framework!

The Simplicity PHP Application Framework is an advanced, scalable and extensible PHP application framework to aid developers in creating high traffic, high availability Web 2.0 online applications. Integrating a solid MVC framework with some of the best Open Source projects around Simplicity aims to assist developers with any amount of experience in taking their applications to a new level.

Mission Statement

Create and evolve a fast and lightweight, yet robust, complete and secure PHP framework, aiding and supporting the PHP developer who wants to use and deploy all the new and exciting Web 2.0 features fast and easy, without the need to become an expert in all the different aspects.

Features

  • Fast and lightweight OO-MVC framework.
  • Tight integration of one of the finest JavaScript frameworks available, Ext 2.0.
  • Full AJAX enabled control panel to manage all aspects of you application this includes database modeling and the creation of stub controllers, and even the addition of predefined actions to speed up development.
  • Database modeling and the creation of stub controllers with the Admin console.
  • Addition of predefined actions to speed up development.
  • Flexible Data Models architecture to allow accessing and even creating relations with almost any data source, Including RDBMS, RSS, LDAP, XML or even just plain text.
  • 100% Buzzword compliant!

Quick intro to Simplicity

Here are some screen shots to give you a taster for the admin console...

This is the 'home tab' of the admin console. Here you can see a quick into to simplicity and a dynamic, real time usage monitor, this gives you the current page views / sec across the site.

This is the 'Registry' of the simplicity application. This is an XML backed cascading hierarchical configuration used you use to hold all configuration for your site. But this is not limited to single, key/value types on information, you can for example store the navigational structure of your application within the registry, so you could have a container called home, and within there a container called children, and in there keys for the children etc. etc. This can be accessed in code as follows:

<? /*
This code refers to the following tree:

navigation
home
info -> 'The info page'
contact -> 'The contact page'
*/
// Here we use the shortcut class to Simplicity_Registry: SRG
$nav = SRG::get('navigation'); // returns the entire navigation tree as an multidimensional array.
$nav = SRG::get('navigation.home'); // returns just the home container as an associative array.
$nav = SRG::get('navigation.home.info'); // here we return the value of the info key, as a string.
?>


This shows the context menus of the Registry tree, showing how you can add keys and containers to the registry.

This is the popup for adding a new root level item to the registry.

This shows the Application Structure section of the application, this is used to display all the current controllers and their methods, currently it is read only, but here you will be able to assign routes (custom URIs) to methods, and even create controllers from scratch directly within the interface.

This shows the data modeling tab of the console. This allows you to create connections to a variety of different data sources, including all RDBMS' supported by php PDOs, CSV and TSV files and raw PHP arrays, with support on the horizon for RSS feeds and more. Once created you can create Models associated with the connections, you do this by creating the model using the context menu, then adding column definitions, each column is a container and contains a variety of properties. Internally all of this is stored in the Registry, showing just how flexible it can be. When a model is defined it can be accessed in the code is a variety of ways:

<?
// Again here we are using the shortcut class for Simplicity_Data : SDA

//Request a specific model directly by id
$user = SDA::getModel('simplicity.users',1);

print $user->name; //outputs the value of the 'name' field.

//Request a group of models using MQL - this will request all the users.
$users = SDA::query('select simplicity.users');

foreach ($users as $user) {
print $user->name.'</br>'; // outputs a list of all users
}

//Filter the results with where and limit
// users with names starting with J.
$users = SDA::query('select simplicity.users where name like "j%"');

// the first 10 users
$users = SDA::query('select simplicity.users limit 10');

// the next ten users, (offset by 10)
$users = SDA::query('select simplicity.users limit 10,10');

//Ordering
// show all users sort by name
$users = SDA::query('select simplicity.users order by name');

// show all users sort by kudos in reverse order.
$users = SDA::query('select simplicity.users order by kudos desc');

?>