The Feature-Oriented Domain Analysis (FODA) Context Diagram is a data flow diagram showing data flows between a generalized application within the domain and the other entities and abstractions with which it communicates. One thing that differentiates the use of data flow diagrams in domain analysis from other typical uses is that the variability of the data flows across the domain boundary must be accounted for with either a set of diagrams or text describing the differences.
The following is an example of a context diagram for the Army Movement Control Domain
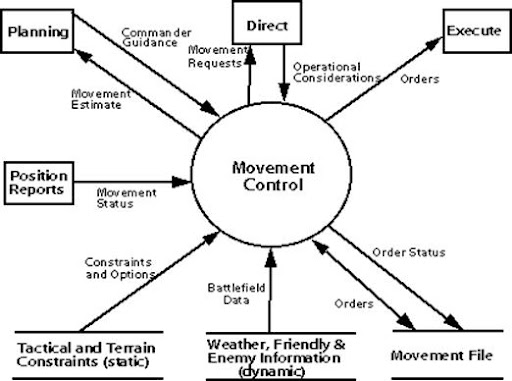
In this context diagram, the information provided to and received from the movement control domain is identified. The arrows represent the information received or generated by the movement control domain. The closed boxes represent the set of sources and sinks of information. The open ended boxes represent the databases that the movement control domain must interact with.
In the movement control domain, most of the data is produced or maintained by operations outside the scope of the domain. For example, all data about weather, terrain, and the disposition of friendly and enemy forces is obtained directly from outside the domain, as shown on the context diagram
Use a Context Diagram at the enterprise level to:
- situate an enterprise in its operating and regulatory environment,
- define the mission of an enterprise or its subcomponents.
Use a Context Diagram at the project level to:
- help define the scope of a project,
- assess potential project benefits and risk factors.
Context Diagrams at the Enterprise Level
A Context Diagram at the enterprise level of detail is referred to as a Business Context Diagram.
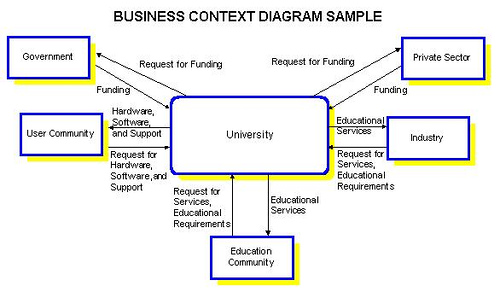
The Business Context Diagram shows the primary relationships between the organization and the external entities with which it deals. It helps to show the main classes of information that the business must manage in dealing with its environment.
External Entities on a Business Context Diagram
An external entity is defined as an external source or destination of data. The organization is concerned only with providing information to or receiving information from an external entity. It is not involved with what the external entity is outside the scope of analysis.
The external entities are defined in an external entities catalogue, and the nature of the relationships (i.e., data flows) are annotated on the lines and arrow heads of the context diagram.
EXAMPLE OF AN EXTERNAL ENTITIES CATALOG
Government Legislation may impact the overall mission of the University and cause changes to strategic and tactical plans. Government funding may also impact these plans by applying constraints to the University's implementation plans.
The User Community, of the University network, both internal and external, will influence strategic and tactical plans by making requests for hardware, software, or support.
Private Sector Funding, to a lesser extent than Government funding, may also apply constraints on the strategic and tactical plans for the University.
Industry, both inside and outside the province, will influence the strategic and tactical plans for the University by making requests to the University for services and setting new educational requirements for University programs.
The Education Community is made up of universities, public schools, vocational schools, private educational institutions, and university educators. This group will influence the strategic and tactical plans for the University in many ways, for example, by making requests for educational services, gaining a competitive advantage through technology, or gaining advancement in educational techniques.
Information Flows on a Business Context Diagram
The information that passes between the organization and the external entities is described by the text above the arrows. The arrows show the directional flow of the information.
Combining Business Context Diagrams
An alternate approach to creating one enterprise level diagram is to create individual Business Context Diagrams for each major component of the enterprise and then combine the diagrams to produce the overall diagram.
Steps to Constructing Context Diagrams at the Enterprise Level
Steps to develop a Business Context Diagram are:
- Draw a process box at the center of the diagram to represent the enterprise.
- Develop a list of candidate external entities (for example, customer, suppliers, government agencies).
- Revise the list, as appropriate, by grouping minor external entities to keep the diagram simple.
- Identify the data inputs and outputs between the enterprise and each external entity.
- Draw the external entities identified by squares on either side of the center box.
- Draw data flows with labels describing the primary relationship between the enterprise and each of the external entities.
- Provide supporting documentation for the external entities and their inputs and outputs.
- Review results with the customer to gain consensus.
Context Diagrams at the Project Level
Typically, a Context Diagram at the project level contains a logical business process and physical data flows.
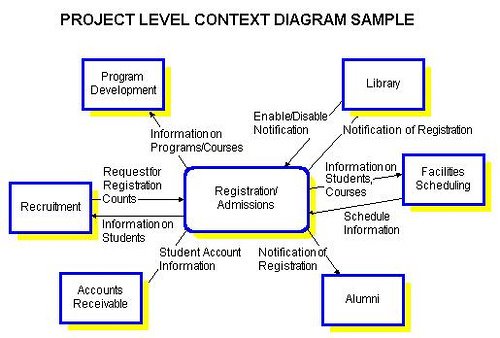
It illustrates the business system, not the computer system. It shows the input and output data flows to a central process that represents the business system under analysis. The context diagram defines the scope of the project.
Project Scope
A Context Diagram confines project scope to an agreed limit by obtaining agreement from the customer on the data flows that are included in the scope of a project. The Context Diagram focuses on relationships with external entities and identifies the information that is exchanged between these external entities and the business system under review. The external entities themselves are outside the scope of the project but the data flows between the entities and the business system are within the project scope.
Level of Detail
The Context Diagram at the project level is the root of the Functional Decomposition at the conceptual level of detail. The Context Diagram is level zero of the decomposition.
Components of a Project Level Context Diagram
A Project Level Context Diagram consists of:
- external entities,
- central process,
- data flows.
External Entities
External entities are also known as terminators, sources/sinks, and actors. External entities define the sources and destinations of information entering and leaving the system. An external entity can be a person, system, or organization that has pre-defined behaviour.
An external entity is outside the domain, or context, of the business area that is under analysis.
Justify the presence of each external entity and describe the role each plays in the scope of the project. Describe the inputs and outputs to and from each external entity.
Central Process
The central or parent process represents the business system that is the target of analysis. It is the highest level process that receives inputs of data from external entities and transforms that data into outputs to the external entities. Provide a brief description (i.e., one page or less) of the central process outlining at a high level the major functionality of the business system under review.
Data Flows
Data flows are the pipelines through which data are transmitted between the external entities and the business processes. They represent the information that flows between the two.
A data flow is also called a data flow vector.
Examples of data flows are:
- purchase order,
- customer profile,
- sales report,
- product.
Naming Data Flows
A data flow is given a name, which describes the content of the data being transmitted, and a description. For example: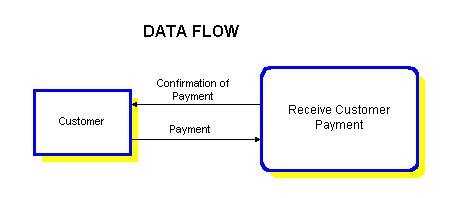
Data Flow Name: Payment
Description: Payments made by customer for goods received.
Steps to Constructing a Project Level Context Diagram
- Identify the external entities that exchange information with the business system that is the target of analysis.
Note: If an organizational Context Diagram exists (from systems planning), extract the external entities and data flows used by the business system under review from the organizational Context Diagram.
- Identify the data flows to and from each external entity.
- Draw a process box at the center of the diagram to represent the highest level business process that will exchange information with the external entities. The central process becomes the root of a process decomposition diagram, such as a Function Chart or Data Flow Diagram, which uses the flow of data as the criteria for decomposition.
No comments:
Post a Comment